VIRINCHI Daily timeframe analysis for long term
NSE:VIRINCHI break trendline and about to breakout initial listing price level 36.
We can see long term move above 36 & can buy more till 33 with SL 30.
Major targets levels are highlighted in blue lines.
Weekly Chart:
Next report date
—
Report period
—
EPS estimate
—
Revenue estimate
—
1.50INR
137.03 MINR
3.00 BINR
About VIRINCHI LTD
Sector
Industry
Headquarters
Hyderabad
Website
Founded
1990
ISIN
INE539B01017
FIGI
BBG000DCF8L1
Virinchi Ltd. engages in the provision of consulting and technology services. Its products includes Qfund, enterprise enabler, FairShare, vendor relations enabler, Virinchi TPIA, eTendering, eLogistics, iAcquisto, online auction, eSales, community collaborator, workflow engine, security provider, data mapping and conversion tool, language processor, enterprise messenger, FAME, HMS, Active, Case Trail and TrakPORT. The company operates through following segments: Information Technology (IT) Products and Concentric Services, IT Enabled Services, and Infrastructure and Real Estate Services. The company was founded by Viswanath Kompella on March 13, 1990 and is headquartered in Hyderabad, India.

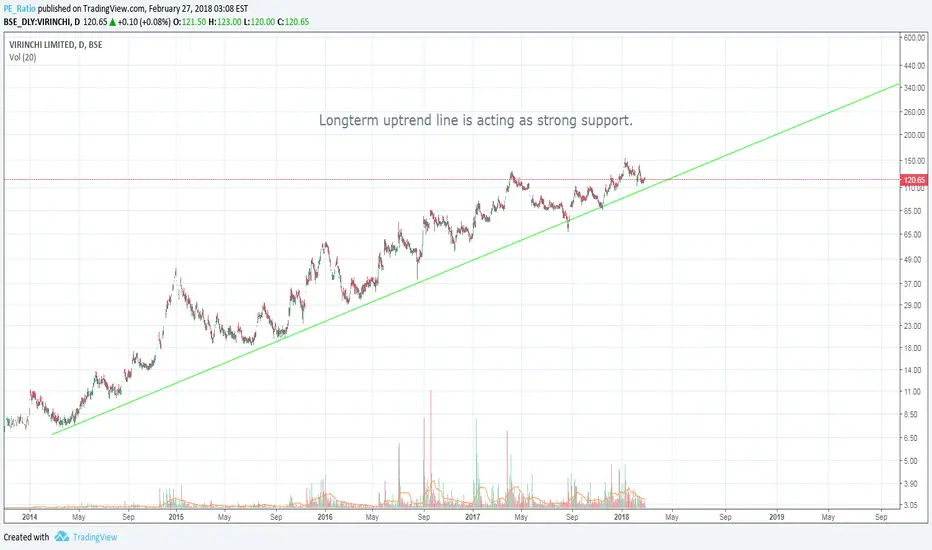
Virinchi Longterm Uptrend line is acting as strong support.This uptrend line has been providing support for 3 years.
Bullish Gartley in the formationXA leg retraced at 0.618. So it can be a Gartley pattern. AB leg retraced at 0.707 (secondary Fibonacci ratio).
CD can be 0.786XA. By that logic, potential reversal could be around 100. Then the bullish move should start.

virinchi LongFirst Target 131 above that target open
Promoters have increased their holdings by 23.16% of holdings in Mar 2017 qtr.
Company has good consistent profit growth of 29.45% over 5 years

See all ideas
Trade directly on the supercharts through our supported, fully-verified and user-reviewed brokers.


Frequently Asked Questions
The current price of VIRINCHI is 39.90 INR — it has increased by 7.84% in the past 24 hours. Watch VIRINCHI LTD stock price performance more closely on the chart.
Depending on the exchange, the stock ticker may vary. For instance, on NSE exchange VIRINCHI LTD stocks are traded under the ticker VIRINCHI.
VIRINCHI stock has risen by 12.24% compared to the previous week, the month change is a 18.75% rise, over the last year VIRINCHI LTD has showed a 12.71% increase.
VIRINCHI reached its all-time high on Jun 21, 2023 with the price of 53.70 INR, and its all-time low was 28.25 INR and was reached on Dec 4, 2023. View more price dynamics on VIRINCHI chart.
See other stocks reaching their highest and lowest prices.
See other stocks reaching their highest and lowest prices.
VIRINCHI stock is 13.33% volatile and has beta coefficient of 0.47. Track VIRINCHI LTD stock price on the chart and check out the list of the most volatile stocks — is VIRINCHI LTD there?
Today VIRINCHI LTD has the market capitalization of 3.48 B, it has decreased by 3.04% over the last week.
Yes, you can track VIRINCHI LTD financials in yearly and quarterly reports right on TradingView.
VIRINCHI LTD is going to release the next earnings report on Aug 28, 2024. Keep track of upcoming events with our Earnings Calendar.
VIRINCHI net income for the last quarter is 21.00 M INR, while the quarter before that showed 56.16 M INR of net income which accounts for −62.60% change. Track more VIRINCHI LTD financial stats to get the full picture.
No, VIRINCHI doesn't pay any dividends to its shareholders. But don't worry, we've prepared a list of high-dividend stocks for you.
EBITDA measures a company's operating performance, its growth signifies an improvement in the efficiency of a company. VIRINCHI LTD EBITDA is 1.09 B INR, and current EBITDA margin is 36.35%. See more stats in VIRINCHI LTD financial statements.
Like other stocks, VIRINCHI shares are traded on stock exchanges, e.g. Nasdaq, Nyse, Euronext, and the easiest way to buy them is through an online stock broker. To do this, you need to open an account and follow a broker's procedures, then start trading. You can trade VIRINCHI LTD stock right from TradingView charts — choose your broker and connect to your account.
Investing in stocks requires a comprehensive research: you should carefully study all the available data, e.g. company's financials, related news, and its technical analysis. So VIRINCHI LTD technincal analysis shows the strong buy rating today, and its 1 week rating is strong buy. Since market conditions are prone to changes, it's worth looking a bit further into the future — according to the 1 month rating VIRINCHI LTD stock shows the strong buy signal. See more of VIRINCHI LTD technicals for a more comprehensive analysis.
If you're still not sure, try looking for inspiration in our curated watchlists.
If you're still not sure, try looking for inspiration in our curated watchlists.