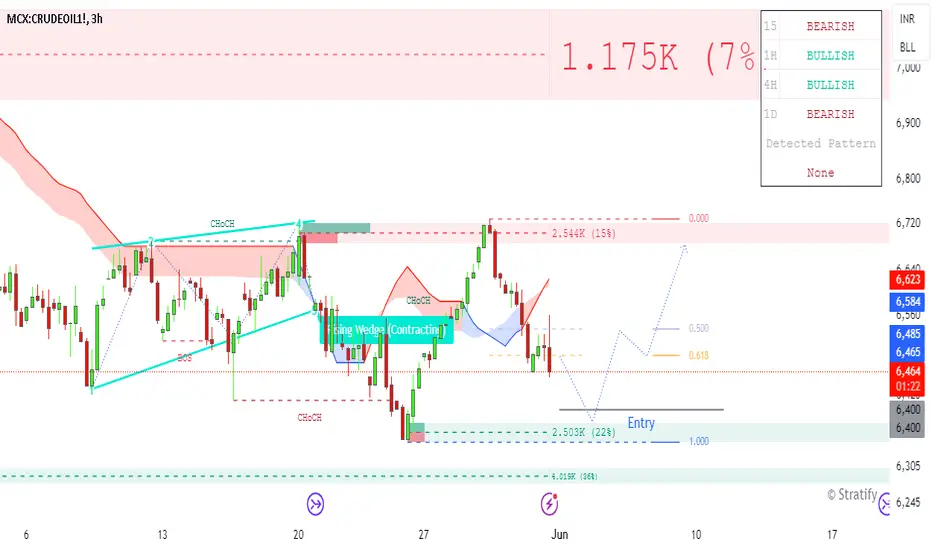
CRUDEOIL Buy Setup 3 hrs TGT with in a 3 daysSuper valid-looking! Leave a comment if you like my entry setup. This share is for educational learning purposes only, and I am not responsible for your profit or loss. Note: For more details, check the chart."
CLZ2018 trade ideas
Thursday Forecast Crude!So my target for this week will be the weekly open.
Simple as that sounds we do have some bsl above however Im expecting price to deliver BEARish as per HTF and the rejection for the Daily FVG
Be aware that trading is light we are in the last couple of days of the Month.

Can the HOUSE CAPITALIZE Long above $80.00 Per Barrel...?NYMEX:CL1!
"If you train hard, you'll not only be hard, you'll be hard to beat." -Herschel Walker
Oil has been struggling to Break above $80.00 Per Barrel roughly this whole month of MAY and this week we could actually see buyers gain strength and get over the hump... However that is a long shot prediction! Now if this actually does come to pass then this is what I'll need to see in order to go LONG...
1) Price is currently trading around a 4Hr Supply Zone. ** I want to see buyers push price up N break the supply zone and continue towards the HTF S&R Zone....
2) We have a HTF Descending eR/LQ Trendline that I want to Buyers Breakout N push towards $80.00 Per Barrel... I would like to see a retest of the Failed 4Hr Supply Zone and eR/LQ trendline for buyers to gain more strength for pushing towards our target...
3) Now if we can get the sequence of events to take place that I stated above, Then we will wait for the break above $80.00 Per barrel with confirmed candle closures above price and above the S&R Zone... I want to see confirmed candle closures on the 30m TF N Below to establish conviction in the move from buyers to enter LONG....
4) Now if we can get the Break above $80.00 Per barrel with confirmed candle closures above price and above the S&R Zone then I'll Enter LONG and Target the break of the 4Hr Supply Zone price ($81.10 Per Barrel) 110 pts to be exact in our favor... Ill set my stop just below the S&R Zone EQ Level giving me roughly around a 2.7RR....
Remember when it comes to FRM (Financial Risk Management) our job is to manage the downside costs of printing High side returns of $$$ consistently... Let's Step!!
Stay Focused & Reach Excellence!!
#BHM500K #NewERA #Champions

CRUDE OIL (CL, USOIL) Weekly Forex Forecast... BULLISH!Looking for price to reach towards 80.11 this week.

Crude Oil continue with the Uptrend On Crude Oil, it's nice to see a strong buying reaction at the price of 79.85 .
There's a significant accumulation of contracts in this area, indicating strong buyer interest. I believe that buyers who entered at this level will defend their long positions. If the price returns to this area, strong buyers will likely push the market up again.
Strong uptrend and high volume cluster are the main reasons for my decision to go long on this trade.
Happy trading
Dale

2024-05-28 - a daily price action after hour update - oilcomment: In my weekly outlook I wrote that 76 was rejected often enough and bulls are favored to at least test the top of the channel around 78.8. They poked enough today and finally broke above. I expect 84 over the next 1-2 weeks. Measured move would bring us to 84.3.
current market cycle: Bear trend broken - Still inside bigger triangle (form of trading range)
key levels: 76 - 84
bull case: Got my clear confirmation today and will look for long entries over the next days. Bulls probably expect a pull-back to maybe the daily 20ema (79) to form a channel). 1h 20ema is currently holding nicely.
Invalid below 78.4.
bear case: Bears stepped aside since Friday US session and we are in a strong bull trend inside this bigger trading range. Bears will try to sell new highs for small scalps. Best they could hope for is moving sideways around 80.
short term: Up - 84 expected over the next 1-2 weeks.
medium-long term: We are seeing the big triangle playing out between 73 and 86 (could also be 87 but for now I see the spike above 83 as a failed breakout of the triangle. We hit the lower trend line and now we will test back up to above 83.
trade of the day: Just buy anywhere. Look which 20ema is holding and buy near it.

Options Blueprint Series: Pre and Post OPEC+ WTI Options PlaysIntroduction
The world of crude oil trading is significantly influenced by the decisions made by the Organization of the Petroleum Exporting Countries (OPEC) and its allies, collectively known as OPEC+. These meetings, which often dictate production levels, can lead to substantial market volatility. Traders and investors closely monitor these events, not only for their immediate impact on oil prices but also for the broader economic implications.
In this article, we explore two sophisticated options strategies designed to capitalize on the volatility surrounding OPEC+ meetings, specifically focusing on WTI Crude Oil Futures Options. We will delve into the double calendar spread, a strategy to exploit the expected rise in implied volatility (IV) before the meeting, and the transition to a long iron condor, which aims to profit from potential post-meeting volatility adjustments.
Understanding the Market Dynamics
OPEC+ meetings are pivotal events in the global oil market, with decisions that can significantly influence crude oil prices. These meetings typically revolve around discussions on production quotas, which directly affect the supply side of the oil market. The anticipation and outcomes of these meetings create a fertile ground for volatility, especially in the days leading up to and immediately following the announcements.
Implied Volatility (IV) Dynamics
Pre-Meeting Volatility: In the days leading up to an OPEC+ meeting, implied volatility (IV) often rises. This increase is driven by market uncertainty and the potential for significant price moves based on the meeting's outcome. Traders buy options to hedge against or speculate on the potential price movements, thereby increasing the demand for options and pushing up IV.
Post-Meeting Volatility: After the meeting, IV can either spike or drop sharply, depending on whether the outcome aligns with market expectations. An unexpected decision can cause a significant IV spike due to the new uncertainty introduced, while a decision in line with expectations can lead to a sharp drop as the uncertainty dissipates.
Strategy 1: Double Calendar Spread
The double calendar spread is a sophisticated options strategy that can potentially take advantage of rising implied volatility (IV) leading up to significant market events, such as the OPEC+ meeting. This strategy involves establishing positions in options with different expiration dates but the same strike price, allowing traders to profit from the increase in IV while managing risk effectively.
Structure
Long Legs: Buy longer-term call and put options.
Short Legs: Sell shorter-term call and put options.
The strategy typically involves setting up two calendar spreads at different strike prices (one higher and one lower), thus the term "double calendar."
Rationale
The rationale behind this strategy is that the longer-term options will experience a greater increase in IV as the event approaches, inflating their premiums more than the shorter-term options. As the short-term options expire, traders can realize a profit from the difference in premiums, assuming IV rises as expected.
Strategy 2: Transition to Long Iron Condor
As the OPEC+ meeting date approaches and the double calendar spread positions reach their peak profitability due to the elevated implied volatility (IV), it becomes strategic to transition into a long iron condor. This shift aims to capitalize on potential volatility changes and capture profits from the expected IV drop.
Structure
Closing the Double Calendar: Close the short-term call and put options from the double calendar spread.
Setting Up the Long Iron Condor: Sell new OTM call and put options with the same expiration date as the long legs of the double calendar spread.
The result is a position where the trader holds long options closer to the money and short options further out, creating a long condor structure.
Rationale
The rationale for transitioning to a long iron condor is to capture profits from a potential decrease in IV after the OPEC+ meeting.
Practical Example
To illustrate the application of the double calendar spread and the transition to a long iron condor, let's walk through a detailed example using hypothetical WTI Crude Oil Futures prices.
Double Calendar Spread Setup
1. Initial Conditions:
Current price of WTI Crude Oil Futures: $77.72 per barrel.
Date: One week before the OPEC+ meeting.
2. Long Legs:
Buy a call option with a strike price of $81, expiring on Jun-7 2024 @ 0.32.
Buy a put option with a strike price of $74, expiring on Jun-7 2024 @ 0.38.
3. Short Legs:
Sell a call option with a strike price of $81, expiring on May-31 2024 @ 0.05.
Sell a put option with a strike price of $74, expiring on May-31 2024 @ 0.09.
Note: We are using the CME Group Options Calculator in order to generate fair value prices and Greeks for any options on futures contracts.
Transition to Long Iron Condor
1. Closing the Double Calendar:
Close the short-term call and put options just before they expire @ 0.01 (assuming they are OTM on Friday May-31, before the market closes for the weekend).
2. Setting Up the Iron Condor:
Sell a call option with a strike price of $82, expiring on Jun-7 2024 @ 0.13.
Sell a put option with a strike price of $73, expiring on Jun-7 2024 @ 0.18.
0.11 and 0.17 are estimated values assuming WTI Crude Oil Futures remains fairly centered around 77.50 and that IV has risen into the OPEC+ meeting weekend.
Transitioning from the Double Calendar to the Long Iron Condor would be done on Friday May-31.
3. Resulting Position:
You now hold a long call at $81, a long put at $74, a short call at $82, and a short put at $73, forming a long iron condor.
The risk of the trade has been reduced by half (assuming the real fills coincide with the estimated values above) from 0.56 to 0.27 = $270 with a potential for reward of up to 0.73 (1 – 0.27) = $730.
This practical example demonstrates how to effectively implement and transition between the double calendar spread and the long iron condor to navigate the volatility surrounding an OPEC+ meeting.
Importance of Risk Management
Effective risk management is crucial when implementing options strategies, particularly around significant market events like the OPEC+ meeting. The volatility and potential for sharp market moves require traders to have robust risk management practices to protect their capital and ensure long-term success.
Avoiding Undefined Risk Exposure
Undefined risk exposure occurs when traders have no clear limit on their potential losses. This can happen with certain options strategies that involve selling naked options. To avoid this, traders should always define their risk by using strategies that have built-in risk limits, such as spreads and condors.
Precise Entries and Exits
Making precise entries and exits is critical in options trading. This involves:
Entering trades at optimal times to maximize potential profits.
Exiting trades at predetermined levels to lock in gains or limit losses.
Adjusting trades based on market conditions and new information.
Additional Risk Management Practices
Diversification: Spread risk across different assets and strategies.
Position Sizing: Allocate only a small percentage of capital to each trade to avoid significant losses from a single position.
Continuous Monitoring: Regularly review and adjust positions as market conditions evolve.
By adhering to these risk management principles, traders can navigate the complexities of the options market and mitigate the risks associated with volatile events like OPEC+ meetings.
Conclusion
Navigating the volatility surrounding significant market events like the OPEC+ meeting requires strategic planning and effective risk management. By implementing the double calendar spread before the meeting, traders can capitalize on the anticipated rise in implied volatility (IV). Transitioning to a long iron condor after the meeting allows traders to benefit from potential post-meeting volatility adjustments or price stabilization.
These strategies, when executed correctly, offer a structured approach to managing market uncertainties and capturing profits from both pre- and post-event volatility. The key lies in precise timing, appropriate strike selection, and diligent risk management practices to protect against adverse market movements.
By understanding and applying these sophisticated options strategies, traders can enhance their ability to navigate the complexities of the crude oil market and leverage the opportunities presented by OPEC+ meetings.
When charting futures, the data provided could be delayed. Traders working with the ticker symbols discussed in this idea may prefer to use CME Group real-time data plan on TradingView: www.tradingview.com This consideration is particularly important for shorter-term traders, whereas it may be less critical for those focused on longer-term trading strategies.
General Disclaimer:
The trade ideas presented herein are solely for illustrative purposes forming a part of a case study intended to demonstrate key principles in risk management within the context of the specific market scenarios discussed. These ideas are not to be interpreted as investment recommendations or financial advice. They do not endorse or promote any specific trading strategies, financial products, or services. The information provided is based on data believed to be reliable; however, its accuracy or completeness cannot be guaranteed. Trading in financial markets involves risks, including the potential loss of principal. Each individual should conduct their own research and consult with professional financial advisors before making any investment decisions. The author or publisher of this content bears no responsibility for any actions taken based on the information provided or for any resultant financial or other losses.

Navigating Crude Oil Volatility Around OPEC MeetingsOPEC is a unique organization whose decisions impact national sovereignty, energy security, and most directly on crude oil prices.
OPEC’s decisions have material influence on crude oil prices. All eyes on OPEC+ ministerial meeting taking place virtually now on June 2 (instead of an in-person meeting on June 1 as planned previously). OPEC is widely expected to roll over its production cuts until year-end to support prices until demand improves.
Supply-Demand balance will tilt in the second half of 2024 if OPEC decides to continue its production cuts as the global economy heads into a season of rising demand.
Source: CME Group OPEC+ Watch Tool as of markets on 27th May 2024
CME Group’s OPEC Watch Tool shows a 79.06% probability of the supply cuts remaining unchanged and an 18.79% likelihood of ease in cuts.
Negotiations within OPEC could be challenging as not all members are satisfied with production cuts.
Iraq's oil minister - Hayyan Abdul Ghani - said his country would not agree to another supply cut, as per Bloomberg . Iraq is OPEC's second-largest oil producer after Saudi Arabia.
Iraq and Kazakhstan's repeated breaches of their supply quotas have caused tension within the group. Promises from both countries to compensate for overproduction have not been kept.
Source: OPEC
OPEC+ has cut output by 5.86m bpd, approximately 5.7% of global demand as per Reuters .
The U.S. followed by China and India are the top three consumers of crude oil. US guzzles 20% with China consuming close to 16% of the world’s oil production.
China’s feeble demand has been a significant headwind and remains so despite its stimulus package.
CHINA'S TEPID DEMAND CONTINUES TO WEIGH ON OIL
China is the largest importer of crude oil and its second biggest consumer. Chinese demand for crude remains tepid.
Its economy is showing signs of recovery but remains uneven. Industrial output surpassed analyst expectations , growing by 6.7% YoY in April. Retail sales rose by 2.3% YoY well below analyst forecasts. Sluggish consumer demand impacts oil consumption. April oil imports fell 8.8% MoM to 44.7m tonnes.
In April, China's Manufacturing PMI rose to 51.4 from 51.1 in March, surpassing analyst expectations of 51.0. Services PMI slightly fell in April to 52.5 but remains in expansionary territory of >50.
Source: TradingView
Consumer Confidence Index rose to 89.1 but remains near record bottom levels. It is well below its average of 109.8 as Chinese consumers remain pessimistic due to persisting property crisis.
Source: TradingView
US SPR BEGINS REFILLING BUT WILL NOT MATERIALLY IMPACT OIL PRICES
The US government remains vigilant about gasoline prices in an election year. President Biden's energy advisor, Amos Hochstein, stated that the Strategic Petroleum Reserve (SPR) has enough stockpiles to address any supply concerns.
The Biden administration has been replenishing the SPR after having depleted it by 180 million barrels in 2022. US government bought back 32.3 million barrels at an average price of USD 76.98/barrel throughout 2023 and early 2024.
Having cancelled purchase of three million barrels due to elevated prices, it resumed refilling by looking to buy 3.3 million barrels earlier this month.
NAVIGATING OPEC DECISION IN JUNE
CME Group’s OPEC Watch Tool shows likelihood of different outcomes using WTI Crude Oil option prices. It assigns likelihood to each outcome based on nearest weekly & monthly options.
Probabilities for the June meeting is derived from the Jul 2024 monthly contract (LON4) and the closest active weekly option prices.
Source: CME Group
The market’s assessment of OPEC’s decision changes dynamically. Navigating a constantly shifting volatile landscape requires liquid instruments that are curated for duration risk. The CME WTI Weekly Options do precisely that.
It enables superior risk management to deftly manage short-term price fluctuations with reduced premiums due to short time-to-expiry. Traders can hedge against near-term price volatility stemming from OPEC meetings, EIA reports, geopolitical events, and weather shocks.
CME Group offers Monday, Wednesday, and Friday weekly options, each with four options available at the beginning of the month, in addition to monthly options. As each weekly option expires, new listings are introduced for the following week. These are settled into WTI Crude Oil futures.
HYPOTHETICAL TRADE SETUP
In the lead up to OPEC+ meeting, implied volatility of WTI prices is low but expected to expand closer to date.
Source: CME Group
Crude oil price action will remain muted if OPEC+ decides to extend its current voluntary cuts of 2.2 million bpd. Weekly options can help harvest near-term volatility to benefit from muted price moves using iron butterflies.
The iron butterfly is a limited reward and limited risk options strategy designed to reap gains during times of low-price volatility.
It involves four legs to the trade, namely, (1) One short ATM call option, (2) One short ATM put option, (3) One long out-of-the-money call option, and (4) One long out-of-the-money put option.
Optimal condition for executing iron butterfly is when implied volatility is high while underlying commodity price action is expected to be mild.
Based on 27/May market prices, the hypothetical trade set up using weekly crude oil options expiring on 3rd June 2024 involves (a) Selling 78 ATM Call, (b) Selling 78 Put, (c) Buying 80 Call, and (d) Buying 76 Put.
Source: CME QuikStrike
At expiry, if WTI June crude oil prices settles between USD 76.6 and USD 79.4, this trade would generate a gain of USD 1.4/barrel or USD 1,400/lot using CME WTI Crude Oil options as each lot represents one thousand barrels.
If crude oil prices rally above USD 79.4/barrel, this trade can rake up maximum loss of up to USD 0.87/barrel or USD 870/lot. If oil prices collapse below USD 76.6, then this trade will result in maximum loss of USD 0.87/barrel or USD 870/lot.
Ignoring transaction costs, the iron butterfly exhibits a reward-to-risk ratio of 1.61x with a maximum upside of USD 1,400/lot and maximum loss of USD 870/lot.
MARKET DATA
CME Real-time Market Data helps identify trading set-ups and express market views better. If you have futures in your trading portfolio, you can check out on CME Group data plans available that suit your trading needs www.tradingview.com
DISCLAIMER
This case study is for educational purposes only and does not constitute investment recommendations or advice. Nor are they used to promote any specific products, or services.
Trading or investment ideas cited here are for illustration only, as an integral part of a case study to demonstrate the fundamental concepts in risk management or trading under the market scenarios being discussed. Please read the FULL DISCLAIMER the link to which is provided in our profile description.

Crude**CrudeOil:**
The forecast is for the price to rise to the top of the channel and then reverse the trend and fall to the key level at 72.69.

Can the HOUSE CAPITALIZE LONG ABOVE DAILY SWING EQ...?NYMEX:CL1!
"To succeed...You need to find something to hold on to, something to motivate you, something to inspire you." -Tony Dorsett
Family, Summer is officially here and I hope everyone is well and in gr8 spirits. Here I am going to give you a detailed narrative as to why I believe we can capitalize LONG on OIL this week juss above Daily Swing EQ Level and Target 70.5% Fib Level Which is the EQ Level of the overall 4Hr Supply Zone.... Risky however still HIGH Probable...Vibe w/me
1) The 1st confirmation I want to see is price break the last 4Hr Swing High ($76.25) and head towards the EQ Fib level ($76.55)/ 4Hr Supply Zone...
2) Now what happens next is what will determine if we go LONG or not.... The only thing that makes me slightly hesitant in taking this LONG is the fact we have an ascending iR/LQ Trendline currently that buyers have created and I know for a fact Sellers need to sweep this liquidity the question is when will they do it?
3) Once we break above the Fib EQ level ($76.55) I need to see a candle closure above price on the 30m TF & Below... However Price could very much so close above inside the 4Hr Supply then sellers step in and drop price to sweep the iR/LQ then buyers push price rii back up above EQ Level... SO its case by case scenario lets just await and see what happens... Ill keep update as PA prints....
Remember when it comes to FRM (Financial Risk Management) our job is to manage the downside costs of printing High side returns of $$$ consistently... Let's Step!!
Stay Focused & Reach Excellence!!
#BHM500K #NewERA #Champions

6/9 | $CLSince losing the 77 support level, we have flushed lower and rebounded. Holding where it needs to for now, but would still like to give this some time to develop. Messy price action and dont want to be caught in the middle of it. Will be interested if we can either reclaim 77, or price comes back down under 74. Otherwise, will be hands off this week on crude oil.

#202424 - a weekly price action market recap and outlook - oilGood Evening and I hope you are well.
wti crude oil futures
Quote from last week:
bear case: Bears sold 80 again and will probably take profits here at 77 or try to get 76 again. If they get a breakout below, we will probably test 75, which is a price I thought we would test for 5-7 weeks now. It’s a bad sell here at 77 for bears so best they can get is sideways movement.
comment: Fair to say that bears surprised me big time on Monday with the huge follow through selling through previous bigger support. 72 stopped the fall and created an expected bounce. I do think this was W5 and my bearish targets are all met for now. Market should move sideways to up from here. On Friday we got a perfect retest of the breakout price of 76 and that was resistance for now. Worst case scenario for bulls would be to stay below 76. The bull trend line will get retested and should hold for now.
current market cycle: Bear trend which could transition into a trading range here
key levels: 72-78
bull case: The best the bulls can hope for, is for the lows to hold and to move sideways and hit the daily ema again. They failed at keeping it above 75, which was huge support. Last bear leg inside this bigger trading range was 11 weeks long from high to low and we are currently at 9 weeks. Bulls will want to find support here around 70-72 and trade back up to at least 78 over the next 8-12 weeks.
Invalidation is below 71.
bear case: Huge bear surprise imo on Monday and bears want to keep it max bearish and they will do that by keeping the market below the breakout price around 76 and below the daily ema. They want a retest of 72.5 again and poke the bull trend line enough for bulls to give up there. If they actually get an acceleration of this bear trend, which is the low probability thing, they could retest 70 next and below 70 comes 67 as support.
Invalidation is above 80.5.
outlook last week: “R:R is on the bull side here at the bottom of this range. I wait for confirmation on Monday before going long for 80 again. Below 76 we could get to 75 but that would require strong momentum for me to go short down here.”
→ Last Sunday we traded 76.99 and now we are at 75.53. High of the week was 77.52 so the uber bearish price action, was surprising to me. I did not advise you to be bullish, unless there confirmation for the bulls and obviously that did not happen. So my bearish target of 75, if we go below 76, was alright but way too short of 72.48. Not a good outlook.
short term: Neutral because I think we will hit the daily ema again and a retest of 72.5ish. I am not a fortune teller so I don’t know which comes first.
medium-long term: We are seeing the big triangle playing out between 73 and 83. The high of the triangle got tested until mid of April and we have now tested the lows around 72.5. Market will probably move more inside this big range until we get a new big cycle to either side.
current swing trade: None
chart update: Added my pretty bear channel, adjusted 5-wave series and added a two-legged pullback, which we are probably in as of now. The red ABC is how I imagine it to play out price-wise, not time wise. We should see a retest of the lows as well as the daily ema. I don’t know which comes before what or when. Also adjusted the big bear trend line from 2022.

break and retest 22 it broke past the trend line and shot to the downside my prediction was incorrect i thought it was going to retest the trendline and shoot the upside. this is important to pay attention to the whole screen or market and really analysis the divergence and trend rather bullish or bearish, practice!


CRUDEOIL 1HDOUBLE BOTTOM PATTERN IS OBSERVED PRICE MAY TOUCH THE RED LINE AND FALLS BECAUSE IT IS A STRONG RESISTANCE LEVEL
I Am Not SEBI Registered Analyst. All Post and Levels Posting is only for educational and knowledge purpose. I Am not responsible for your any kind of loss or profit.
No Claim, All Rights Reserved.‼️

2024-06-04 - a daily price action after hour update - oilGood Evening and I hope you are well.
wti crude oil
comment: Yeah oil again. This is in play and you should look for strong momentum trades.
current market cycle: Bear trend
key levels: 70-77
bull case: Yesterday I said bulls need to keep it above 74 or we see 72. Low of the day was 72.48. 1h 20ema was resistance and bulls need a close above that. Still the same argument as yesterday. They need to stop new lows and make market go sideways. They also retested the bear channel from last week, from which we broke below, and they were rejected. Only thing they have going for now is that on higher tf you can clearly see 3 pushes down. Would still not look to buy other than scalping.
Invalid below 70
bear case: Globex marked the high of the day and the 15m 20ema was resistance until 1h before US open. From there the market was in a trading range until it touched the 1h 20ema and sold off again. Bears want to keep the momentum going to get to 70 because that would be a clear brake of the bull trend line. Measured move from the last 5 trading days would bring us to 64. Next target for bears is a trade below 72 and then 70 if the momentum keeps going but we are near the lower bear channel line and market will probably need to move sideways to up first.
short term: It’s only going down so look for short entries. I expect a pull-back soon but it could just be a shallow one where we move sideways.
medium-long term: We are seeing the big triangle playing out between 73 and 86 (could also be 87 but for now I see the spike above 83 as a failed breakout of the triangle. We hit the lower trend line and now we will test back up to above 83. —will update this Wednesday
trade of the day: If you weren’t short during Globex, tricky to trade tbh. You could scalp every new high for a short but you really need to know what you are doing. Can also just not trade this or wait for the 1h 20ema touch for a short.

CL waiting for BOS on 15 min to go longCL waiting for BOS and pullback for entry from 15 min fvg LONG

WEEKLY FOREX FORECAST: NASDAQ, SP500, DOW, CRUDE OIL (Part 2)We are covering the indices and crude oil in this video.
Providing analysis for the week of June 3-7th.

#202423 - a weekly price action market recap and outlook - oilGood Evening and I hope you are well.
wti crude oil futures
Quote from last week:
bull case: Bulls rejected 76 area 4 times now. At some point one side will concede and we see a bigger move. Patience pays. Bulls want retest of the daily 20ema and bear channel next (78.8). Afterwards break above the bear channel. Bears had two clear pushes down and now a tripple bottom. I think they will give up and market trades back up again. But I wait for clear confirmation on this.
comment: Here is also my comment from last week “Market in total balance 76 - 80. Buy low and sell high. Right now I prefer a spike below to around 75 which bulls gladly buy and we then trade back to 83 over the next weeks. Invalid below 74.”
Nothing changed in Oil. Bulls got a very small spike above 80 which was rejected again and we are 77 again. Play the range until we get a breakout with follow through. One funny “coincidence” is that the 50% pull-back from the 2021 low to the 2022 high, is about 78.3 and now guess where the freaking 50% pb of this trading range is. Market is always giving some hints. Learn to spot them.
current market cycle: Trading range
key levels: 76 - 80
bull case: Ascending triangle with around 4 highs and 4 lows. Market is in breakout mode and will probably test lower or higher prices next. I have absolutely no idea where we will break out first so just do the high probability thing here, buy low and sell high when you see good signal bars. Bulls see this as the lows of this trading range and want to reverse here for at least 80 again.
Invalidation is below 67.
bear case: Bears sold 80 again and will probably take profits here at 77 or try to get 76 again. If they get a breakout below, we will probably test 75, which is a price I thought we would test for 5-7 weeks now. It’s a bad sell here at 77 for bears so best they can get is sideways movement.
Invalidation is above 80.5.
outlook last week: “Kinda neutral 76 - 80. Clear trading range with tails above and below. Market in balance. R:R here is with the bulls for test of daily 20ema at 78.6 again.”
→ Last Sunday we traded 77.72 and now we are at 76.99. High of the week was 80.62 and I said we will probably at least hit the daily ema again. That was a perfect outlook for at least 90 ticks but could have held til 80 or higher. 80 Would have been 228 ticks. Hope you made some.
short term: R:R is on the bull side here at the bottom of this range. I wait for confirmation on Monday before going long for 80 again. Below 76 we could get to 75 but that would require strong momentum for me to go short down here.
medium-long term: We are seeing the big triangle playing out between 73 and 83 (could also be 87 but for now I see the spike above 83 as a failed breakout of the triangle and now we test the lower trend line again. —unchanged
current swing trade: None
Update: removed bull flag/bear trend, whatever you want to call it. It’s the same and you trade it the same. Added expanding triangle trend lines

Mastering Top-Down Analysis: Spot High Probability SetupsDiscover how to elevate your trading game using a powerful top-down approach across multiple time frames. Using real-time examples from Oil Crude Futures, you'll learn to identify the key price signatures that signal high-probability entries.
Gain valuable insights on:
Implementing a top-down analysis to spot lucrative trading opportunities
Recognizing specific price patterns that indicate optimal entry points
Setting realistic trade expectations and defining your targets
Framing your entries with precision on lower time frames


Crude Oil, Not Out of the Woods YetThe chart above references continuous (front-month) Crude Oil, below we are discussing the July contract.
Crude Oil (July)
Yesterday’s close: Settled 79.83, up 2.11
WTI Crude Oil futures cleared the psychological $80 mark, but can it settle above? A major catalyst to start the week was strong travel demand data from the U.S. over the Memorial Day weekend and from China of late. We also believe geopolitical tailwinds are more relevant than headlines may give credit at the moment. Ultimately, weakness last week came on the heels of the White House announcing a release of Gasoline reserves ahead of the weekend and this was quickly shaken off and further helped create a technical bottom at a critical area of support we have been highlighting.
Still, price action is not in the clear, and we find it a good time to monetize some of this move at least if you’ve been able to capitalize as it is testing major three-star resistance at 81.15-81.28, aligning a gap with the 50% retracement back to the April 12th high. Additionally, the 50-day moving average comes in at 80.84.
Bias: Bullish/Neutral
Resistance: 81.15-81.28***, 82.03-82.34***
Pivot: 79.97-80.11***
Support: 79.46-79.61**, 79.01-79.05*, 78.66-78.78***, 77.72-78.05***
*Trade ideas cited above are for illustration only, as an integral part of a case study to demonstrate the fundamental concepts in risk management under the market scenarios being discussed. They shall not be construed as investment recommendations or advice. Nor are they used to promote any specific products, or services.
Futures trading involves substantial risk of loss and may not be suitable for all investors. Trading advice is based on information taken from trade and statistical services and other sources Blue Line Futures, LLC believes are reliable. We do not guarantee that such information is accurate or complete and it should not be relied upon as such. Trading advice reflects our good faith judgment at a specific time and is subject to change without notice. There is no guarantee that the advice we give will result in profitable trades. All trading decisions will be made by the account holder. Past performance is not necessarily indicative of future results.
