CL BUY POSITION This position based on the MCT STRATEGY and order block
Risk reward is 1:3
Entry: 70.26
Close: 70.86
Good luck traders
CLX2019 trade ideas

CL Short Position This position based on the MCT STRATEGY and order block
The details of tge position is:
Risk reward is 1:3
Entry in 70.20
Close in 69.80

CRUDE OILPreferably suitable for scalping and accurate as long as you enter carefully the price behavior with the drawn areas.
With your likes and comments, you give me enough energy to provide the best analysis on an ongoing basis.
And if you needed any analysis that was not on the page, you can ask me with a comment or a personal message..
Enjoy Trading... ;)

Crudeoil 1D TF, bullish trendline breaksHere on chart you can see the support horizontal line mark .
Trend line acting as resistance.
Break out will bullish structure

CrudeIt is consolidating in small range for last 3 week. There can be trending move in either side in coming week. Bias is on long side as natural gas has already given a move, crude can be the next candidate.

Crude Oil Outlook Mired by Negative Slope in 50-Day SMAThe price of oil appears to be defending the monthly low ($66.80) as it extends the rebound from the weekly low ($67.05), but failure to push above the 50-Day SMA ($71.95) may undermine the recent rebound in crude as the moving average reflects a negative slope.
Crude Oil Outlook
The price of oil may track the June range as it attempts to push above the $70.00 (50% Fibonacci extension) to $70.60 (61.8% Fibonacci retracement) region, with a push above the moving average raising the scope for a run at the June high ($75.06).
Next area of interest comes in around $75.60 (38.2% Fibonacci extension), but crude may track the negative slope in the moving average if it struggles to break/close above the $70.00 (50% Fibonacci extension) to $70.60 (61.8% Fibonacci retracement) region.
Failure to defend the monthly low ($66.80) may push crude towards $64.40 (61.8% Fibonacci extension), with a move below the yearly low ($63.64) opening up the $54.40 (78.6% Fibonacci retracement) to $56.50 (78.6% Fibonacci extension) area.
--- Written by David Song, Strategist

CRUDE OILPreferably suitable for scalping and accurate as long as you enter carefully the price behavior with the drawn areas.
With your likes and comments, you give me enough energy to provide the best analysis on an ongoing basis.
And if you needed any analysis that was not on the page, you can ask me with a comment or a personal message..
Enjoy Trading... ;)

WTI rallies form range lows - break of $70 up next?WTI crude posted a strong rally from the $67 support level thanks to another strong drawdown of crude inventories. The fact it rallied over 3% despite the stronger US dollar and hawkish comments from Powell makes us wonder if it could have broken above $70 were the dollar not to dominate FX majors on Wednesday. Still, prices are trading within a range between $67 - $72/73, and whilst prices action remains choppy o the daily chart there are some opportunities to trade the range on lower timeframes.
A triple bottom has formed on the daily along with a 2bar bullish reversal (bullish piercing line). String volumes accompanied the rally from the $67.50 area to show demand around those lows and the OBV (on balance volume) broke above its previous swig high, which hints at a breakout for prices.
Prices are drifting higher at the open, but we’d consider bullish setups above or around the daily pivot point or 10/20 EMAs if prices pullback for a potential swing-trade long to $70.A break above which brings the resistance zones around $71 and $72 into focus.

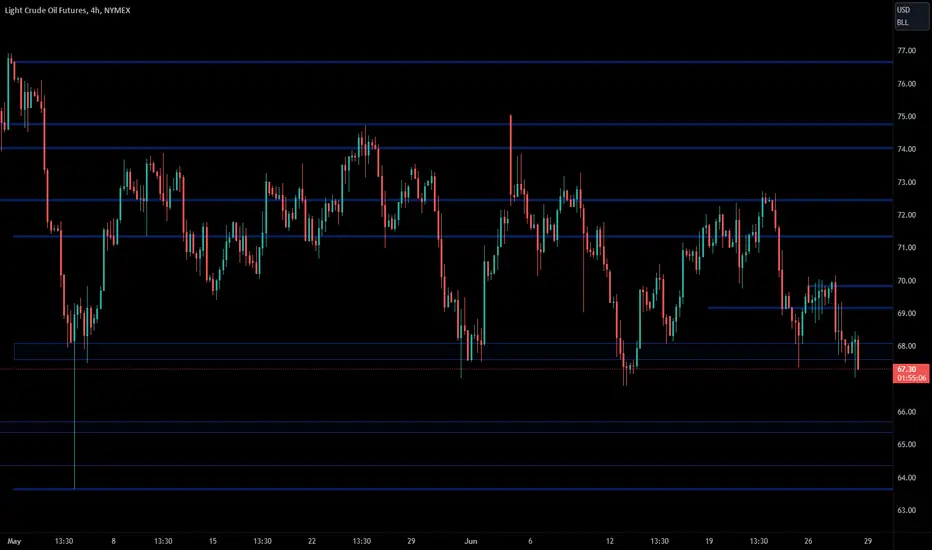
WTI Light Sweet Crude Oil, 6/29/23For Thursday, the 67.08 level can contain weekly selling pressures, above which 72.77 is attainable by the end of next week, possibly yielding 77.17 by the end of July.
Upside Thursday, 69.95 can contain session strength, while closing above 69.95 signals 72.77 within 2-3 days, where the market can top out into later next week and the point to settle above for yielding the more meaningful 77.17 within 3-5 more days.
Downside Thursday, closing below 67.08 indicates 64.10 within 3-5 days, 62.14 longer-term support within 2-3 weeks, where the broader market can bottom out through summer activity

CRUDE OIL REMAINS INDECISIVEOil prices surged nearly 3% on Wednesday, recovering from the previous day's losses, driven by a significant decrease in U.S. crude stockpiles. However, concerns about interest rates and central banks' fight against inflation limited the rally. WTI rose 2.8% to $69.62 per barrel. This marked the first significant gain in oil prices in a week. The Energy Information Administration reported a substantial 9.603-million-barrel drawdown in U.S. crude inventories, the largest weekly decline since May. Gasoline inventories built up slightly, while distillate stockpiles saw a modest increase.
Oil is facing uncertainty from Saudi Arabia implements production cuts as well, while central banks prepare to raise interest rates. The outcome is difficult to predict as economic growth continues in the West despite concerns of a recession. If Saudi Arabia's efforts fail, they may flood the market with supply. The correlation between oil demand, economic growth, and rising interest rates adds complexity to the situation. Lower oil prices and potential market fluctuations are expected. Overall, the interplay between various factors makes it challenging to make accurate predictions about oil prices.
On the technical site, RSI remains neutral, while MACD index continues to show sell signals.
The instrument might reach levels of 68.45 from which it might pivot to bearish territory, otherwise it might face resistance at 69.40 and 71.10 price levels.
Risk Disclosure: Trading Foreign Exchange (Forex) and Contracts of Difference (CFD's) carries a high level of risk. By registering and signing up, any client affirms their understanding of their own personal accountability for all transactions performed within their account and recognizes the risks associated with trading on such markets and on such sites. Furthermore, one understands that the company carries zero influence over transactions, markets, and trading signals, therefore, cannot be held liable nor guarantee any profits or losses.

4 Hr Cypher set up on $OIL $CL_F $USOIL $USO Wait for price action at 786 Fib level for long entry. Pin Bar, IB, Engulfing Bar, or low tf harmonic .
Full plan in chart, 2 % max risk on play, Suggest 1% <
Stop below X needs room 66.75$ or so.
I will share entry if triggered, I will leave an overnight limit as well if it does not trade, (smaller size on limit)
Tp stop is to entry, Aim higher, leave a runner, always.
The plan never changes, just the trading vehicle.. GL guys :)


CRUDE OILPreferably suitable for scalping and accurate as long as you enter carefully the price behavior with the drawn areas.
With your likes and comments, you give me enough energy to provide the best analysis on an ongoing basis.
And if you needed any analysis that was not on the page, you can ask me with a comment or a personal message..
Enjoy Trading... ;)
A Divergence Breakout Trading Setup Divergence is an indication of a market reversal.
However, traders always trapped into a lost trade if the market is entered with a wrong knowledge of the divergence setup.
Here is my setup identifying a valid divergence, and identifying a false breakout after a divergence.
In this strategy, I will use these indicators:
1. EMA 14: To confirm market direction (Buy or sell)
2. Commodity channel index (default setting): To identify market divergence
3. MACD: to confirm market buy/sell and validity of a divergence setup
4. Price action
5. Trendlines

CL - ShortPrice on the 4H chart is near supply inside a rising symmetrical triangle pattern. I expect price to head lower from these levels.


CRUDE OILPreferably suitable for scalping and accurate as long as you enter carefully the price behavior with the drawn areas.
With your likes and comments, you give me enough energy to provide the best analysis on an ongoing basis.
And if you needed any analysis that was not on the page, you can ask me with a comment or a personal message..
Enjoy Trading... ;)

WTI Light Sweet Crude Oil, 6/27/23For Tuesday, the 67.08 level can contain weekly selling pressures, above which 72.92 is attainable within the week, possibly yielding 77.00 within 2-3 weeks.
Upside Tuesday, 70.67 can contain session strength, while closing above 70.67 signals 72.92 within 2-3 days, where the market can top out through the balance of the week and the point to settle above for yielding the more meaningful 77.00 within 3-5 more days.
Downside Tuesday, closing below 67.08 indicates 64.67 within the week, 62.14 longer-term support within 1-2 weeks, where the broader market can bottom out through summer activity

CRUDE OILPreferably suitable for scalping and accurate as long as you enter carefully the price behavior with the drawn areas.
With your likes and comments, you give me enough energy to provide the best analysis on an ongoing basis.
And if you needed any analysis that was not on the page, you can ask me with a comment or a personal message..
Enjoy Trading... ;)


WTI: Crude Oil May Have Bottomed OutNYMEX: WTI Crude Oil ( NYMEX:CL1! ), Micro Crude Oil ( NYMEX:MCL1! )
The talk of inflation deceleration created a wishful misperception. Does a CPI read from 9.1% to 4.0% mean price relief for consumer? Certainly not. Something costed $1 last year will go up to $1.04 this year on average. What really comes down is the rate and the pace of price increase, but the absolute price level has forever gone up.
This makes the real decline in energy prices more extraordinary:
• On June 23rd, WTI crude oil ( NYSE:CL ) August futures settled at $69.16 a barrel. This is 44% below last June’s high of $123.70;
• At $2.44 a gallon, RBOB gasoline futures ( SIX:RB ) declined 34% year-over-year;
• At $2.37 a gallon, ULSD diesel futures ( EURONEXT:HO ) price dropped 45% YoY.
• At the retail level, the American Automobile Association reports the national average regular gasoline price at $3.57 a gallon on June 25th, down 27% YoY;
• The AAA diesel price is now $3.89/gallon, falling 33% YoY.
However, the era of low energy prices may be coming to an end. I am convinced that the market dynamic has changed. Elevated geopolitical tension, higher demand and a weak dollar could help pull crude oil out of the bottom, and onto an upward trajectory.
Global Tension Forms Solid Price Support
A week after the start of Russia-Ukraine conflict in February 2022, Crude oil futures shot up 30% from below $90 to $115. WTI peaked at $121 in June as the fighting continued.
Since then, high inflation and rate hikes raised the risk of global recession. As the demand outlook dimmed, oil price lost support and trended down in the past year.
Geopolitical tension may have been placed on the back burner, but it never went away. Last Saturday, the Russian private army Wagner Group mounted a short-lived rebellion against the Kremlin. What this means to the Ukraine conflict and the stability of Russia itself remain to be seen.
Geopolitical crisis could cause supply shock and raise the price of crude oil. My observation is that global tension will be at an elevated level throughout 2023 and 2024.
Oil Demand is Expected to Recover
Last July, I called the peak of gas price in this report. I discovered that record $5 gas had caused demand to fumble. AAA gas price surprisingly declined at the start of the traditional summer driving season.
Things look different now. Retail gas price creeped up 50 cents (+13%) since December. Many stations popped up gas price ahead of the July 4th holiday. With a still strong job market and inflation in check, consumers are taking their summer vacations.
A second key demand factor comes from the US government. The Biden Administration has drawn down the Strategic Petroleum Reserve (SPR) to fight high oil price in the last two years. The Energy Information Agency data shows that the SPR holds 350 million barrels of crude oil as of June 16th. This is 285 million barrels less than the level on January 24th, 2020, the week when President Biden first took office. SPR is now at a critical four-decade low level.
The Department of Energy has begun replenishing the SPR. It announced buying up to 3 million barrels in May, and recently planned additional purchase of 6 million in August.
Thirdly, the risk of global economic recession is now lower than what we previously feared. This is my most important reason for raising the outlook of future oil demand.
• The Federal Reserve implemented ten consecutive interest rate increases since March 2022. US inflation rate has declined from the peak of 9.1% to 4.0% in May. Lowering inflation may have averted the US economy from falling on a hard landing.
• The banking failures, from Silicon Valley Bank to Signature Bank, First Republic, and Credit Suisse, have met with swift government rescue efforts. We have so far managed to contain these from spreading to systemic risk.
• The resolution of US debt ceiling crisis helped avoid a US default and a likely global financial crisis it may trigger. According to the USDebtClock.org, the US national debt is now $32.1 trillion, which is $700 billion more than the previous debt limit.
• The Biden-McCarthy deal in federal spending limits ensures that government budget will not be cut. The federal government accounts for one quarter of the US economy. As bad as it may sound, government spending spree with borrowed money does contribute to near-term economic growth. We just kick the can forward and leave the debt burden to future generations.
A Weak Dollar Supports Higher Oil Price
Last year, the main investment theme of global commodities market was “Strong Dollar, Weak Commodities” and “High Rate, Low Price”. We are now in a reverse course.
The US dollar index peaked at 114 in last September. While the Fed raised rates aggressively, other countries were slow in response, resulting in widening interest rate spreads between the US dollar and major foreign currencies. Since then, the Fed reduced the size of rate hikes from 75 bp to 50 and then 25, while UK and ECB caught up with bigger rate increases. The dollar index has fallen to 100 by April.
The Fed paused rate increase in its June meeting. Although it emphasizes in fighting inflation, there is no question that the monetary tightening cycle is now in its last stretch.
NYMEX WTI Crude Oil Futures
With the key factors discussed above, plus the OPEC having incentive to cut output, I could see WTI going back to the $80-$90 range.
December WTI (CLZ3) currently quotes $69.1 a barrel. Each contract has a notional value of 1,000 barrels. Margin requirement is $5,000 to place one contract.
Hypothetically, if Dec futures goes up to $80, one long contract would gain $10,900 (=10.9*1000). Theoretical return would be +118% (=10,900/5,000-1), excluding transaction fees.
The risk of long WTI is falling oil price. If CLZ3 falls to $65, a long position would lose $4,100. This would result in a Margin Call, with the Exchange requiring the trader to deposit fund and bring the account balance back to $5,000.
Alternatively, we could consider the Micro Crude Oil Futures ( CSE:MCL ). Contract size is one tenth of the standard CL contract. And so is the margin requirement. Everything else works the same.
Happy Trading.
Disclaimers
*Trade ideas cited above are for illustration only, as an integral part of a case study to demonstrate the fundamental concepts in risk management under the market scenarios being discussed. They shall not be construed as investment recommendations or advice. Nor are they used to promote any specific products, or services.
CME Real-time Market Data help identify trading set-ups and express my market views. If you have futures in your trading portfolio, you can check out on CME Group data plans available that suit your trading needs www.tradingview.com

WTI Light Sweet Crude Oil, 6/26/23A two-sided framework continues through summer between 62.14 long-term support, and 82.21 long-term resistance, both regions able to contain seasonal activity.
Downside, a weekly settlement below 62.14 indicates 53.87 within several months, longer term Fibonacci support able to contain selling into later year.
Upside, a weekly settlement above 82.21 indicates 94.67 within several months, able to contain annual highs.
-
For Monday, the 67.08 level can contain weekly selling pressures, above which 72.87 attainable within the week, possibly yielding 76.91 within 2 - 3 weeks.
Upside Monday, 70.67 can contain session strength, while closing above 70.67 signals 72.87 within 2 - 3 days, where the market can top out through the balance of the week and the point to settle above for yielding the more meaningful 76.91 within 3 - 5 more days.
Downside Monday, closing below 67.08 indicates 64.67 within the week, 62.14 longer-term support within 1 - 2 weeks, where the broader market can bottom out through summer activity.

Is CL bottoming? or a move back lowerCL has to make a decision I am looking at the sell-offs and shows that either a good support area and buying area or a break could result in a move back into the $50's again.
There is also some divergence n the MACD
Do your analysis and decide ... i favour a stalling in the down move and a bounce into the mid $70's
