Gasoline Plummets Along with Crude as Markets See Huge SellingHeadlines:
• Gasoline Plummets Along with Crude as Markets See Huge Selling
• Futures in Asia Prepare for the Worst as They Plummet Heading into the Session
• EU and US Markets Plunge as Investors Flee
RT1! trade ideas

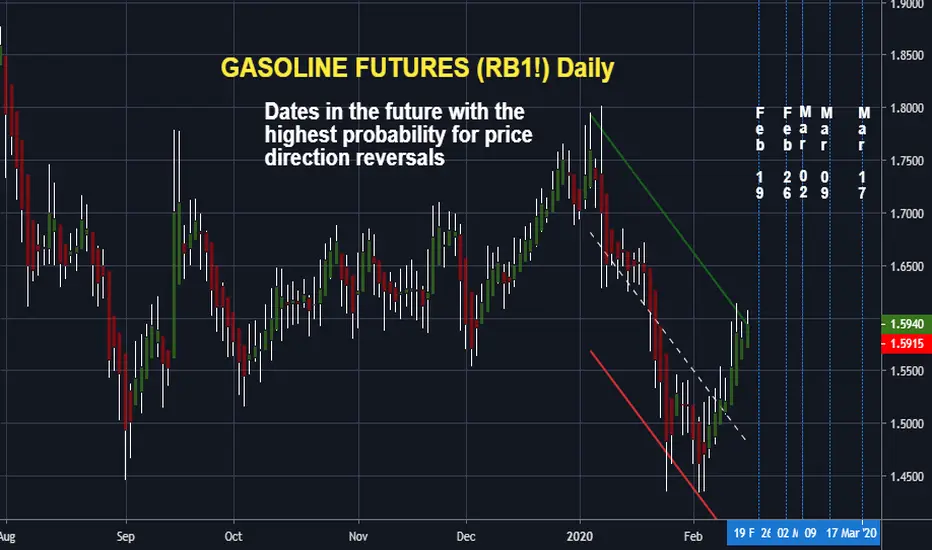
GASOLINE FUTURES (RB1!) DailyDates in the future with the highest probability for price direction reversals

OPEC Monthly Report to be Released to Markets During the SessionHeadlines:
• OPEC Monthly Report to be Releases to Markets During the Session
• US Coronavirus Cases Tops 1,000 as More City Officials Record Cases
• Futures Market Lower as Traders Head into US Session

EIA Crude Stock Continues + Gasoline & Distillate Stock DropsHeadlines:
• EIA Crude Inventory See Stockpiles Continues Whilst Gasoline & Distillate Stock Drops
• Surging Indexes Spurred on by Stimulus Measures with S&P500 +4.22%
• Coronavirus Cases Slow Down in China Whilst See Rises in Italy & Iran

Gasoline Down + Oil Extends Losses in Asia With Crude DownHeadlines:
• Crude Extends its Losses in Asia With NYMEX Crude Down -3.16% + RBOB Gasoline Down -3.29%
• UN Secretary General Calls for Immediate Ceasefire After 33 Turkish Soldiers Killed in Idlib
• Asian Equities Feel Full Force of Sell Pressure with Nikkei225 Down -4.60%

RBOB Gasoline Falls as Global Fear Resonates Throughout MarketHeadlines:
• Light Crude Futures Fall Below $50pb as Global Fear Resonates Throughout Markets
• CDC Warns That They Could Expect Further Cases and to be Ready
• US Equities Continue Low Streak with Markets Down Another -3%

API Data Shows Gasoline -2.668m For the WeekHeadlines
• API Data Shows Crude Up +4.164m Whilst Gasoline Down -2.668m
• Maduro Looks for Alternate Ways to Sustain Economy as Oil Production Slides
• Canadian CPI Numbers Up Beating Analyst Expectation

GASOLINE FUTURES (RB1!) DailyDates in the future with the highest probability for price direction reversals
RBOB Gasoline Futures Sitting at Important 1.5900-1.6000 ZoneHeadlines
• RBOB Gasoline Futures Sitting at Important 1.5900-1.6000 Zone
• Natural Gas Surges on Open Gapping Up +3%
• Japan Releases Disappointing GDP (-1.6%) for the Quarter Seeing Japanese Indexes Drop
• US Set to Observe Presidents Day Holiday During Monday

Gasoline will soon follow the fall in crude oil prices.The EIA has revised down it's forecast for fuels demand, due to the impact of coronavirus on China GDP and dropping fuel demand in that country.

RB1! Downtrend Above 40 RSIRBOB Gasoline Futures is in a strong downtrend, and the price broke above the 40 RSI line on the daily chart . Therefore, we can anticipate an upward retracement into a quality supply zone . I used a volume profile to find the area with the heaviest volumes within that same daily zone.

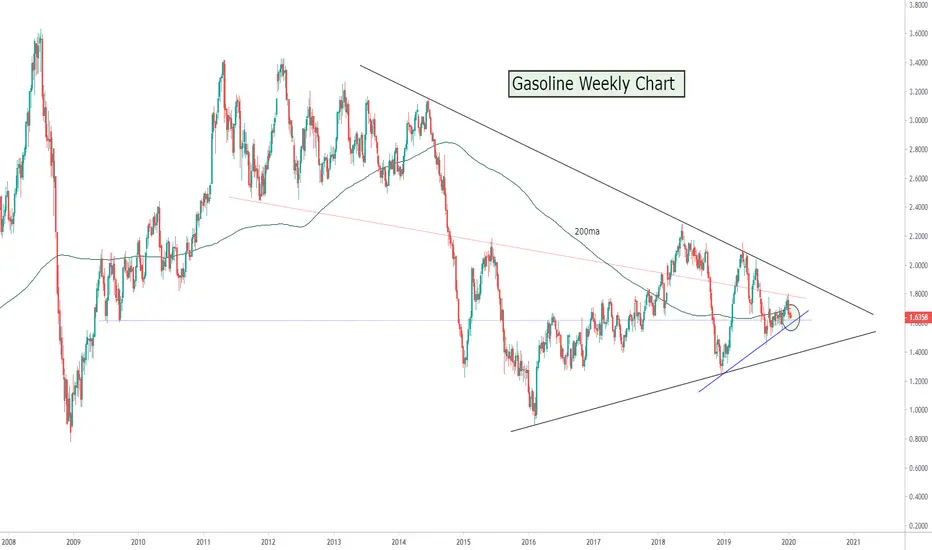
Gasoline Weekly Chart.Looking to short Gasoline below dual support (at the eclipse) with the first target at 1.4575. A convincing break below trendline support (triangle) look for 1.2605, further downside pressure could see 1.0323 as a third target. On the fundamental front, 'Smart Money Hedgers' have increased their bearish exposure to this market substantially. The time frame for this trade is mid to long term.
Gasoline Futures Finish The Week FlatGasoline prices finished relatively flat after recovering mid-week from falls of around -4% to finishing the week at 1.5041. Data released by EIA did show slightly better than expected build data lower than analyst expectations. This did have a slight impact on pricing which did assist in this pullback we did see. Saying this though, this is the 12 weeks straight of build data which has been released to markets. Build data has increased from the beginning of the November market of last year.

GASOLINE RBOB - Possible topI already told, here in this blog, dozens of times how powerful this signal is. You can check here how and when it triggers. Checking the chart for gasoline rbob, you will see how effective this was last time it gets activated. This is the second week in a row we have this signal poping in the cot tool, and from the last signal to now the instrument already moved 10 USD down. More to come!
You will see in the second chart that this is the biggest long position held by the big speculators. So we have a clear exhaustion of buying power(check explanation), a major drop is expected!
In the third image, you will see big speculators positioning organized from biggest to lowest.
Check the post here
leohermoso.com

Long-Term Prospects of RBOB GasolineThe RBOB Gasoline is in a Bear Market Rally with price trading above the 50 ema, which is below the 200 ema, which is below the 800 week ema. The 50 week ema is currently slightly up trending, but by and large the long term emas are mostly flat. This implies an accumulation/distribution zone. The intermediate term Elliott Wave requires a rally above 1.7785 to complete this c of the x-wave (which is currently taking place) before resumption of the Primary b-wave to bottom below 1.4475. From a fundamental perspective this is likely to happen by Spring, just in time for prices to head back up for the Summer driving Season.
The Market is in a Bear Market Rally on the daily, with price above the 50 ema, which is below the 200 ema, which is below the 800 ema. Price is trading up against a long-term down trend line currently above the 9/13/30/50 emas and is completing the third of three pushes up. A likely upside target for this rally is 1.8366 which is the weekly 800 ema, and above the a-wave high of 1.7785. We’re still in an uptrend as long as each day closes above the 13 ema which is currently at 1.7066.
The Market is giving early warning of a possible Bull Market on the 4 hour, with price above the 50 ema, which is above the 800 ema, but the 200 ema is still below the 800 ema. Price would have to close below 1.794 for this Bear Market Rally to be considered over. The Oil Market is rallying as a result of Middle Eastern turmoil, as well as all the FED Repo and Not-QE money creating a Risk On environment.
I would expect this market to rally into over-head resistance here in January, and then turn down for a little while as the excess end of year REPO money unwinds, and turmoil in the ME subsides for a little while. This would allow the x-wave to top, and the market to sell off into the y-wave bottom.
This is my RBOB Gasoline look ahead for my own trading purposes. FUTURES trading involves risk. Feel free to comment, but trade off of this post at your own peril.


Gasoline Long small position 1/2 sizestop @ 1.5850 target 1.8120 the reason I say small position is because its a cheap asset making any size move larger in percentage. should the trade move against us I will be taking 3 other positions small as well.
2nd 1.67, 3rd 1.66, 4th @ 1.6480
Another reason why I love this position is because the roll over on the buy side pays 26% interest annualy so holding it is worth while.

RBOB Gasoline Futures (Jan 2020) - Rectangle in formationNYMEX:RBF2020
Clear rectangle on the January Futures of the RBOB Gasoline.
A breakout could lead to an interesting trend to ride.
When trading commodities and futures contracts you should always take into account the specifications of each contract to calculate exactly how many contracts to buy or sell short on the basis of your risk management and position sizing.
www.cmegroup.com

Gasoline: Repeating a 1980s pattern. Major bullish break ahead.We have discovered a 1980s pattern on Gasoline (RB) that is strikingly simalar the recent candle action on 1W. We are rather puzzled though as to which point of the 1980s sequence we are currently at.
In 1980s the Golden Cross (MA50 over MA200) emerged after a Double Bottom. Currently we are past that Golden Cross and the price is approaching the last low on a sequence bearing many similar characteristics with the old pattern. This leads us to believe that the Golden Cross is irrelevant on this pattern and that the price mostly follows the trend of the 1W MA50 into similar benchmarks of the 1980 pattern.
For that reason it may be viable to start taking long positions with a projected Target Zone of 2.5000 - 2.8000.
** If you like our free content follow our profile (www.tradingview.com) to get more daily ideas. **
Comments and likes are greatly appreciated.


RBOB breaking out into up channelWe are now well into the driving season with additional incentive moving the crack margins upwards: namely the loss of the Philadelphia PES Refinery -ve 335 kbbl capacity and no obvious solution to the shipping risk in the Straits of Hormuz. RBOB has been very responsive to a simple channel moves for many months. There is no need to over complicate RBOB. It's a straight buy.
