$ANF #INF getting new is old again , but chart looks great , not like one's woke things ..
They are back with style
ANF trade ideas

ANF Abercrombie & Fitch Options Ahead of EarningsAnalyzing the options chain of ANF Abercrombie & Fitch prior to the earnings report this week,
I would consider purchasing the 23usd strike price Calls with
an expiration date of 2023-5-26,
for a premium of approximately $1.55
If these options prove to be profitable prior to the earnings release, I would sell at least half of them.
Looking forward to read your opinion about it.

ANF ready for a big stormTHE CONSISTENT TRADES analyze ANF as a bearish/weak fundamental stock and therefore would be traded only in a short position.
ANF daily is in a rising wedge pattern which after the breakout is very bearish. On Friday it shot up but got rejected from the trendline and formed a shooting star reversal pattern.
Volume does not confirm this price action which is bearish.
However, it is above all major MA which is bullish.
RSI has big and nasty bearish negative divergences which indicate a huge drop is incoming. Only only those divergences are smaller it is bigger and bigger because while the price is moving up RSI is moving down, very bearish.
The same situation is with MACD. Very bearish.
Overall: ANF even though it had nice bullish momentum, RSI and MACD are showing us there is no real bull market here on this stock. An imminent drop is very likely and drops out of a rising wedge would trigger a perfect short opportunity. For more educated traders this level could already be a short position with a stop loss of 1/4 of the last candle above the last high.

ANF: Sell After a Retracement -INTRODUCTION-
Everyone’s favorite clothing company Abercrombie & Fitch is tanking. The stock gapped down to the $18.50 level after a bad earnings annoucement this week. Therefore, we will look for sell entries after a retracement.
-TRADING PLAN-
ANF is moving in a downtrend, making lower lows and lower highs. We currently have a gap at the $26.00 level. Current RSI is oversold so therefore, we expect a short-term retracement to the $26.00 level to fill the gap. Our area of interest to enter sell positions is $26.00 ~ $30.00 level. From this area, we will observe for a consolidation pattern. After a breakout from the pattern, we will then prepare our sell entries. We do expect at least one more retest of the recent low at $18.00 level.
We only trade with the trend and we don't enter trade to capture the retracement part, meaning we don't try to predict the bottom. If the price made a retracement back to our area of interest, then we will prepare our entries. If the price did not reach, then we will look for other opportunities :)
Check out our ongoing and previous stock trading ideas below :)

$ANF Double tops with bearish flag forming ! $ANF Double tops with bearish flag forming !
- Double tops on the weekly
- Perfect entry on the bear flag

wait for confirmation first, but looks like puts can pay 🔥ANF currently sitting below a strong resistance zone, If we break above calls/shares can keep paying.
target 33,03-31.82 if we break trendline support, this is the most likely scenario in my opinion..
Like and follow for more! 💘

Mark Minervini's Style Analysisbought on 4th Jan at point:
1) price -consolidate very close to EMA21 even EMA50
2) volume -very well under the average
3) atr -was decreasing
4) on that day, volume were double than prev. day
might:
EP: prev. day high ($20.94)
SL: $19.64 (6.21%)
TREND must be in order!!
-small one above the bigger one
-EMA200 was up for a month
-price doubled in the last 6 months
-recent correction: 20%

ANF: bearish symetrical triangle3 Months : symetrical triangle => bearish
1 Month : symetriclal triangle => bearish
5 Days : descending triangle => bearish
1 Day : descending triangle => bearish
-----
I'll wait until consolidation between 31.50 and 32$, then maybe open a long position.
There's a divergence on a 1 month period: volume is increasing at buy and RSI is neutral, so my chart analysis could be totally wrong.
-----
However, some news confirms my bearish sentiment:
7 january 2022 = UBS has reduced it's target to $37 instead of $68, recommendation = neutral instead of buy.
8 january 2022 = SimplyWallStreet: price target decreased to $49 (8 analysts).
SimplyWallStreet: insider trading volume = insiders have only sold shares (no buyings) in the past 3 months ($391k, 10k shares)
-----
Bear in mind COVID and Omicron as always.
-----
All that mixed up, I don't like what's happening here (bearish sentiment).


ANF Daily SetupNYSE:ANF setup:
MACD crossing up
Bullish bar today broke the trend line
20 EMA crossed above 50 EMA and they are both accelerating up together
3 bottoms since August
Enter above today's high at 39.87
Stop under today's low at 38.42
(More conservative stop is under local low at 36.82)
Take profit just under July high at 47.12
Risk/Reward ratio of 5.0

ANF daily chart- ready to go up By breaking through the resistance 39.00, the falling wedge pattern is confirmed
Buy target 47.29
Stop losses if it closes below 36.00

ANF - Bearish H&S - PT 30On the monthly, we can see a double bottom pattern breakout that has yet to back test the previous resistance which happens more often than not. The daily H&S pattern gives us an implied move to do exactly this before moving up again. I would be more of a buyer in that 29-30 range if it can should support here.
Should see an ABCDE Descending Triangle Wave Playout over the longterm and would follow this for my trading range.

ANF - Bearish H&S - PT 30ANF has a H&S pattern on the daily with an RSI trending under 50 and MACD under 0. If able to breakdown below the neckline, we should see an implied move towards 29-30 where 30.10 represents an old resistance area that should now have good support.
Daily timeframe Short Term: Bearish

Opened short term long position in AbercrombieANF touched the lower bandwith of the uptrend... Speculative long position was opened with only 1% risk

Abercrombie and Fitch maybe soon in a good buying zoneAbercrombie is very strong the last month and established a good upward trend.


ANF- D chrt and 30m charton 30m chart
SELL around 15.45
T1 14.95
T2 14.60
on daily chart
SELL 16.10 to 16.50
T1 13.00
T2 10.80
SL closing up 18.85
The expected time to achieve the target is in the half hour of one to three weeks
The expected time to achieve the target on a daily basis, a maximum of three months

$ANF showing excellent "Buy and Ride" signsWith the indices showing solid signs that they might continue their bullish run and ANF being at solid support I think right now might be one of the best prices to buy into this.
Of-course lower lows could come and the pattern could fail... we cannot decide which setup with be the winner and which the loser.
I didn't add an SL here as I bought the stock on revolut physically. This is a buy and hold for now.

Alex Vieira Urges SELL SHORT AMERICANS MASSIVELY LAUGHING HARDAlex Vieira Urges SELL SHORT AMERICANS MASSIVELY LAUGHING HARD


ANF Good entry for pre earnings playANF is currently oversold according to the daily stochastic indicator and 200 day MA. However it overcame the 50 day MA, and is above both the daily Ichimoku Cloud and the weekly pivot P. In addition there is a bullish crossover on the stochastic.
The target is .786 fib = 18.00 which also lines up with the 200 day MA.
Target =18.00 (+4.66%)
Stop loss = 17.00 (-0.87%)

THE WEEK AHEAD: ANF, BBY EARNINGS; XOP, EWZ, GDX, SMHIt's a short market week here, but this is what we've got ... .
EARNINGS:
HPE (43/33): Announces Monday after market close.
ANF (85/80): Announces Tuesday before market open.
BBY (70/42): Announces Tuesday before market open.
HPQ (50/36): Announces Tuesday after market close
DE (34/29): Announces Wednesday before market open.
Of these, ANF and BBY appear most appealing from a volatility contract standpoint.
The setup pictured here is an ANF 16 short straddle in the December 20th month, paying 2.87 (.72 at 25% max) versus 15.93 spot (18.0%), with the defined risk 11/16/16/21 iron fly paying 2.60 with a buying power effect of 2.40 (.65 at 25% max).
The BBY December 20th 65/80 short strangle is paying 1.75 (.88 at 50% max), with the correspondent 60/65/80/85 iron condor in the same cycle paying 1.60 (.80 at 50% max).
EXCHANGE-TRADED FUNDS:
TLT (36/12)
SLV (29/20)
GLD (23/11)
USO (21/33)
XLE (19/20)
As with last week, short duration premium selling remains less than ideal here, so either hand sit, keeping powder dry, or look to deploy in longer duration setups. Here's what's on my list for longer duration setups in which at background implied volatility is higher:
XOP: January, where the at-the-money short straddle is paying 2.20 versus 21.05 spot (10.5%)
EWZ: March, where the at-the-money short straddle is paying 5.12 versus 43.16 spot (11.9%)
GDX: March, where the at-the-money short straddle is paying 3.14 versus 26.76 spot (11.7%)
SMH: May, where the at-the-money short straddle is paying 17.95 versus 130.92 spot (13.7%)
BROAD MARKET:
SPY 10/13
IWM (7/16)
QQQ (7/16)
As with the exchange-traded funds, you're looking at either hand sitting on shorter duration setups or going out farther in time to get paid, with the expiries in which the at-the-money short straddle is paying greater than 10% in September for SPY and June for both IWM and QQQ (ugh).
FUTURES:
/6B (67/12)
/NG (41/60)
/6C (30/5)
/SI (29/18)
/GC (23/11)
Cable I get, but what's with the Loonie?
VIX/VIX DERIVATIVES:
With the January, February, and March contracts trading at 16.68, 17.76, and 18.05 respectively as of Friday close, VIX term structure trades in those expiries remain viable. For all other short volatility trades, I'd wait for a VIX pop above 20 to consider starting to add short position, as well as consider taking off some risk if we see another drop back into the 2019 lows at 12. It finished Friday at 12.34 ... .

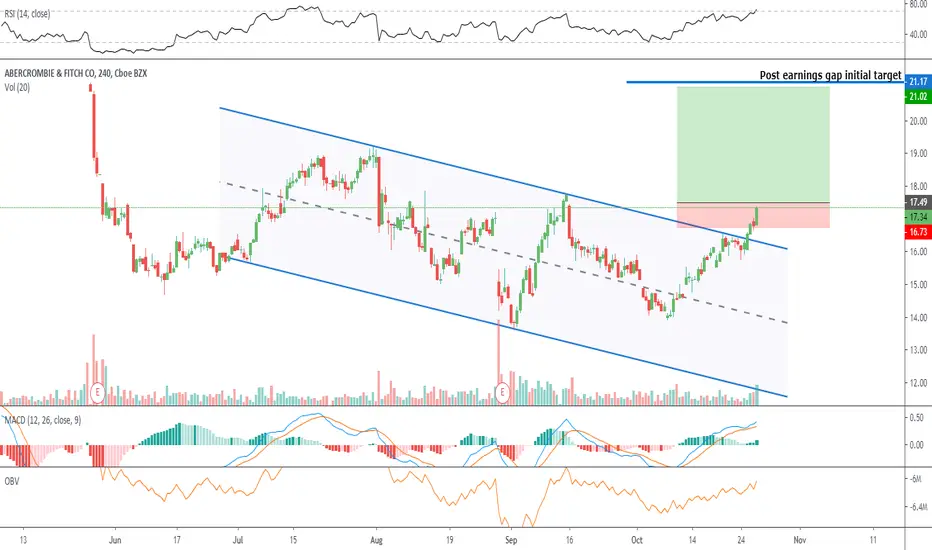
$ANF Option traders see reversal Abercrombie % Fitch Entry level $17.50 = Target price $21.00 = Stop loss $16.60
Considerable high options call traded signalling a positive move in the weeks to come.
Technically broken out of well defined channel, possible back test before move higher.
P/E ratio 17.20
Yield 4.61% quite rewarding.
Very high short interest @20.58% , short covering could ignite a rally on any positive news.