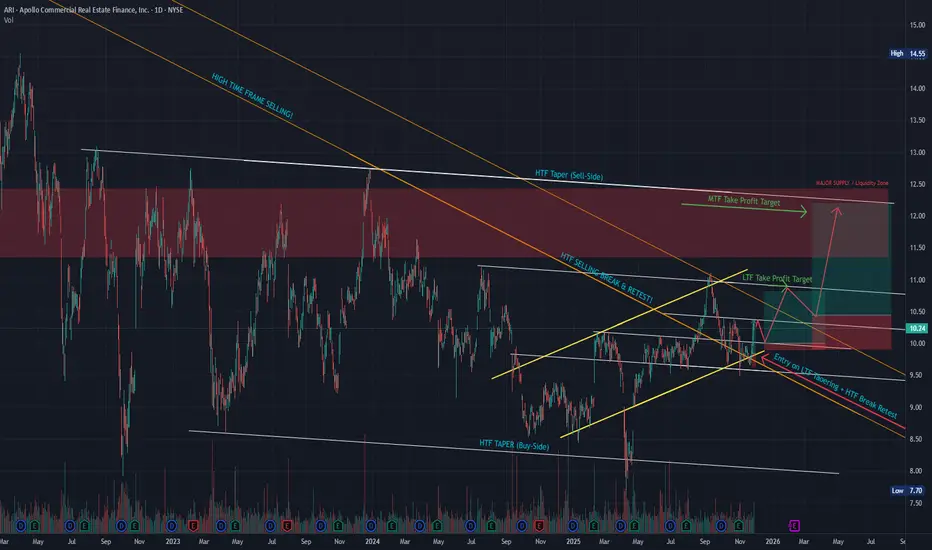
Is this breakout real? Multi-TF High R:R Trade PotentialThis follows the same idea as I outlined in a recently posted ARI Video - but it's straight forward enough to put into a post as well for those who don't love videos.
Why is this so enticing?
HTF Strong Selling trend line break with HTF bullish tapering (white algos). By confirming white, we bro
Compare with Apollo Commercial Real Estate Finance, Inc
0.79 USD
124.19 M USD
710.49 M USD
127.21 M
Next report date
—
Report period
—
EPS estimate
—
Revenue estimate
—
Company info
Sector
Industry
CEO
Stuart A. Rothstein
Website
Headquarters
New York
Founded
2009
IPO date
Sep 24, 2009
ISIN
US03762U1051
CUSIP
03762U105
FIGI
BBG000NFPF36
Identifiers
ISIN US03762U1051
Apollo Commercial Real Estate Finance, Inc. engages in the provision of real estate investment trust. It offers loan programs that include senior loans, subordinate debt, bridge loans, and preferred equity. The company was founded on June 29, 2009 and is headquartered in New York, NY.
Is this breakout real? 7 R:R trade potentialVery unfamiliar name to many I'm sure so this may not get seen much. But we are seeing the potential start to a nice HTF move.
The key here is building tapered liquidity in white while respecting yellow buying. That will allow for a healthy continuation of this breakout of the HTF strong selling tr
ARI Long Entry Set UpARI can be seen to be on an uptrend, given the higher lows that it has been forming, and the breaking of the retest and failure pivot at around the price of $9.46. Entry point could be when the candle crosses the $9.46 mark as that could be a confirmation of the end of the retracement.
Your future is unknown, but if I had to guess...This stock is currently consolidating it's past trend and has not yet chosen a new direction. Wait for it to confirm a new trend after it breaks either the top or bottom resistance line.
My guess is that this will end up breaking lower and heading south again. Real estate is being hit fairly hard
See all ideas
Summarizing what the indicators are suggesting.
Neutral
Neutral
Neutral
An aggregate view of professional's ratings.
Neutral
Neutral
Neutral
Displays a symbol's price movements over previous years to identify recurring trends.
Frequently asked questions
The current price of ARI is 6.40 USD — it has decreased by −1.40% in the past 24 hours. Watch Apollo Commercial Real Estate Finance, Inc stock price performance more closely on the chart.
Depending on the exchange, the stock ticker may vary. For instance, on NYSE exchange Apollo Commercial Real Estate Finance, Inc stocks are traded under the ticker ARI.
ARI stock has risen by 1.77% compared to the previous week, the month change is a −4.37% fall, over the last year Apollo Commercial Real Estate Finance, Inc has showed a −37.38% decrease.
We've gathered analysts' opinions on Apollo Commercial Real Estate Finance, Inc future price: according to them, ARI price has a max estimate of 8.25 USD and a min estimate of 7.75 USD. Watch ARI chart and read a more detailed Apollo Commercial Real Estate Finance, Inc stock forecast: see what analysts think of Apollo Commercial Real Estate Finance, Inc and suggest that you do with its stocks.
ARI stock is 1.42% volatile and has beta coefficient of 0.81. Track Apollo Commercial Real Estate Finance, Inc stock price on the chart and check out the list of the most volatile stocks — is Apollo Commercial Real Estate Finance, Inc there?
Today Apollo Commercial Real Estate Finance, Inc has the market capitalization of 811.11 M, it has increased by 0.81% over the last week.
Yes, you can track Apollo Commercial Real Estate Finance, Inc financials in yearly and quarterly reports right on TradingView.
Apollo Commercial Real Estate Finance, Inc is going to release the next earnings report on Nov 4, 2026. Keep track of upcoming events with our Earnings Calendar.
ARI earnings for the last quarter are 0.15 USD per share, whereas the estimation was 0.11 USD resulting in a 42.33% surprise. The estimated earnings for the next quarter are −0.20 USD per share. See more details about Apollo Commercial Real Estate Finance, Inc earnings.
Apollo Commercial Real Estate Finance, Inc revenue for the last quarter amounts to 44.38 M USD, despite the estimated figure of 34.70 M USD. In the next quarter, revenue is expected to reach 26.12 M USD.
ARI net income for the last quarter is 17.23 M USD, while the quarter before that showed 25.66 M USD of net income which accounts for 0.00% change. Track more Apollo Commercial Real Estate Finance, Inc financial stats to get the full picture.
EBITDA measures a company's operating performance, its growth signifies an improvement in the efficiency of a company. Apollo Commercial Real Estate Finance, Inc EBITDA is 540.29 M USD, and current EBITDA margin is 67.39%. See more stats in Apollo Commercial Real Estate Finance, Inc financial statements.
Like other stocks, ARI shares are traded on stock exchanges, e.g. Nasdaq, Nyse, Euronext, and the easiest way to buy them is through an online stock broker. To do this, you need to open an account and follow a broker's procedures, then start trading. You can trade Apollo Commercial Real Estate Finance, Inc stock right from TradingView charts — choose your broker and connect to your account.
Investing in stocks requires a comprehensive research: you should carefully study all the available data, e.g. company's financials, related news, and its technical analysis. So Apollo Commercial Real Estate Finance, Inc technincal analysis shows the neutral today, and its 1 week rating is sell. Since market conditions are prone to changes, it's worth looking a bit further into the future — according to the 1 month rating Apollo Commercial Real Estate Finance, Inc stock shows the sell signal. See more of Apollo Commercial Real Estate Finance, Inc technicals for a more comprehensive analysis.