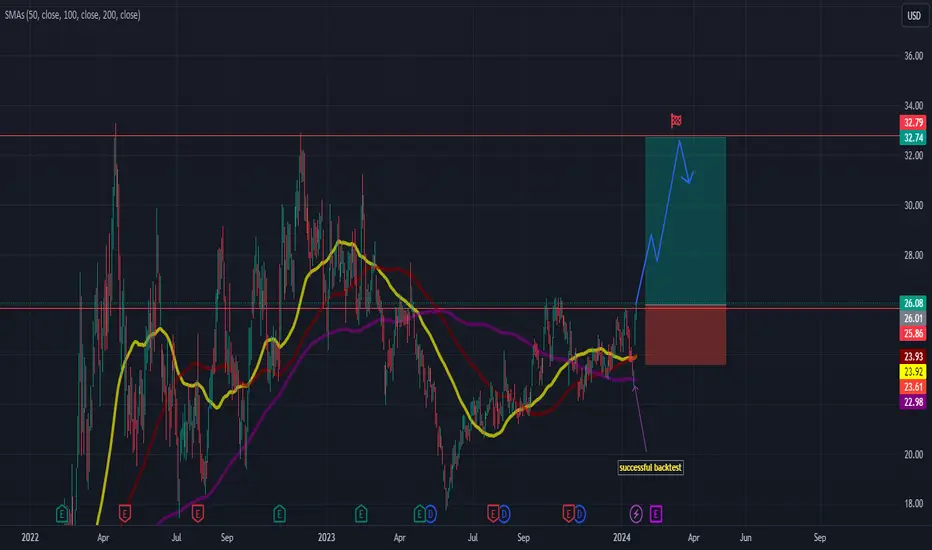
$BTUSome form of M shape harmonic.
3 Rising Valleys.
On the 3rd valley, there was a backtest of previous valley which is good.
Above support zone and 200SMA
Stop = A close below previous low & under support area.
Targets = A & C of structure.
Next report date
Report period
Q1 2024
EPS estimate
0.31USD
Revenue estimate
980.03 MUSD
5.51USD
759.60 MUSD
4.87 BUSD
127.76 M
About Peabody Energy Corporation
Sector
Industry
CEO
James C. Grech
Website
Headquarters
St. Louis
Employees (FY)
5.4 K
Founded
1883
FIGI
BBG00GBV88T6
Peabody Energy Corp. engages in the business of coal mining. It operates through the following business segments: Powder River Basin, Midwestern U.S., Western U.S., Seaborne Metallurgical, Seaborne Thermal Mining and Corporate and Other. The Powder River Basin Mining segment consists of its mines in Wyoming. The Midwestern U.S. includes Illinois and Indiana mining operations. The Western U.S. reflects the aggregation of its New Mexico, Arizona and Colorado mining operations. The Seaborne Metallurgical covers mines in Queensland, Australia. The Seaborne Thermal Mining handles operations in New South Wales, Australia. The Corporate and Other segment includes selling and administrative expenses, results from equity affiliates, corporate hedging activities and trading and brokerage activities. The company was founded by Francis S. Peabody in 1883 and is headquartered in St. Louis, MO.

BTU ready for a pumpHi traders
BTU looks good here. It's breaking the horizontal resistance and the probability of reaching 32 -33 $ in the next weeks is high.
The price successfuly retested 200 SMA and confirmed it once again as a support.
Entry, target and stop loss are shown on the chart.
Risk-Reward ratio: 2,8
Commodities: Coal Recovery Cycle Soon: Peabody Energy BTU ARCHColumn: How a bankruptcy filing shielded a big coal company from California’s climate-change lawsuits
Peabody Energy, the nation’s largest private-sector coal company, joined several of its fellow coal producers in bankruptcy in 2016. Its main goal was to wriggle out from under more than $10 billio

Peabody energy share price prediction There’s a upcoming short Buy of +\- 60% and from there price is going to crash which won’t be good news for investors
this is not a financial advice or any sort

BtuLOng scenario it touched pitchfork bottom line so we can small stop loss big win if this trend still continue

BTU Long • The optimum strategy for BTU: Momentum 160
• Start price: 28,90
• Current stop-loss: 26,785
• Trailing stop-loss: ATR(14) x 1,4
• Projected annual return: +132%
• Take profit: not installed
• Average trades per month: 1
• Average profit per 1 trade: +6,74%
• Strategy win-rate: 47%
• Technical

$BTU target hit looking Long to $34This is kinda fun following one stock to pick timing and levels for highs/lows. So far, we've gotten the swing high price & time to go short. Now it's hit the low I was expecting, BUT, the timing is not until Thurs. 12/9. Still, I have that today is the low for the week and it's 5 cents from the num

$BTU Hit tgt now short till $29.27ishKicking myself a bit today for not reviewing BTU when it was at the top of my calendar for today. (See my prior idea on BTU going to $32.xx with today's date as targets.)
I do dowsing, and when I get a target hit at a particular date that was given in my reading, it almost always implies a reversal

$BTU target $32.25ishThis was a great entry yesterday, but I didn't do a reading on it until now. Dowsing though has the target at $32.25 area and the date is 8 days from now, 11/30. If both price and time hit together, take the money and consider a short.

rejection from extreme resistance? 🔴rejection here and break below 27.22 leads to big selloff, break of 30.40 and I expect new all time highs to follow. no trigga no trade 🎯
Drop boost and follow for more <3

See all ideas
Trade directly on the supercharts through our supported, fully-verified and user-reviewed brokers.


Frequently Asked Questions
The current price of BTU is 23.94 USD — it has increased by 2.05% in the past 24 hours.
Depending on the exchange, the stock ticker may vary. For instance, on NYSE exchange Peabody Energy Corporation stocks are traded under the ticker BTU.
Peabody Energy Corporation is going to release the next earnings report on Apr 26, 2024. Keep track of upcoming events with our Earnings Calendar.
BTU stock is 3.32% volatile and has beta coefficient of −0.09. Check out the list of the most volatile stocks — is Peabody Energy Corporation there?
BTU earnings for the last quarter are 0.80 USD per share, whereas the estimation was 0.98 USD resulting in a −18.73% surprise. The estimated earnings for the next quarter are 1.40 USD per share. See more details about Peabody Energy Corporation earnings.
Peabody Energy Corporation revenue for the last quarter amounts to 1.08 B USD despite the estimated figure of 1.10 B USD. In the next quarter revenue is expected to reach 1.23 B USD.
Yes, you can track Peabody Energy Corporation financials in yearly and quarterly reports right on TradingView.
BTU stock has fallen by 0.66% compared to the previous week, the month change is a 1.07% fall, over the last year Peabody Energy Corporation has showed a 1.03% decrease.
BTU net income for the last quarter is 192.00 M USD, while the quarter before that showed 119.90 M USD of net income which accounts for 60.13% change. Track more Peabody Energy Corporation financial stats to get the full picture.
Today Peabody Energy Corporation has the market capitalization of 3.01 B, it has decreased by 0.75% over the last week.
Yes, BTU dividends are paid quarterly. The last dividend per share was 0.08 USD. As of today, Dividend Yield (TTM)% is 1.28%. Tracking Peabody Energy Corporation dividends might help you take more informed decisions.
Like other stocks, BTU shares are traded on stock exchanges, e.g. Nasdaq, Nyse, Euronext, and the easiest way to buy them is through an online stock broker. To do this, you need to open an account and follow a broker's procedures, then start trading. You can trade Peabody Energy Corporation stock right from TradingView charts — choose your broker and connect to your account.
As of Apr 26, 2024, the company has 5.40 K employees. See our rating of the largest employees — is Peabody Energy Corporation on this list?
Investing in stocks requires a comprehensive research: you should carefully study all the available data, e.g. company's financials, related news, and its technical analysis. So Peabody Energy Corporation technincal analysis shows the buy rating today, and its 1 week rating is sell. Since market conditions are prone to changes, it's worth looking a bit further into the future — according to the 1 month rating Peabody Energy Corporation stock shows the neutral signal. See more of Peabody Energy Corporation technicals for a more comprehensive analysis.
If you're still not sure, try looking for inspiration in our curated watchlists.
If you're still not sure, try looking for inspiration in our curated watchlists.
We've gathered analysts' opinions on Peabody Energy Corporation future price: according to them, BTU price has a max estimate of 32.00 USD and a min estimate of 25.00 USD. Read a more detailed Peabody Energy Corporation forecast: see what analysts think of Peabody Energy Corporation and suggest that you do with its stocks.
EBITDA measures a company's operating performance, its growth signifies an improvement in the efficiency of a company. Peabody Energy Corporation EBITDA is 1.35 B USD, and current EBITDA margin is 27.81%. See more stats in Peabody Energy Corporation financial statements.