Capital One COF - Short - Another failure to break 200 DMARSI says oversold but everything else says it has further downside to come. Might not last long but for now I am short.
14th Candle cleared it of is vital MAs and it's probably got more room to slip. To the upside it could test 68 again and bring RSI up to 50 again before the trend continues. We will see if it gets rejected from here on Monday
COF/PJ trade ideas


COF wSo on the weekly a 14% drop inside on the weekly chart but, tried to gain momentum puke and support held again at $67.80 . Now the question is will this take out $70.13 low or take out the 14% to the upside I’d like to see a new signals coming into a new interesting year


COFWedge Descending and broadening looks confirmed here but needs to close the week above this trend line

COF is a good indicator of middle class purchasing.A roll-over of COF is not good for the retail stocks.


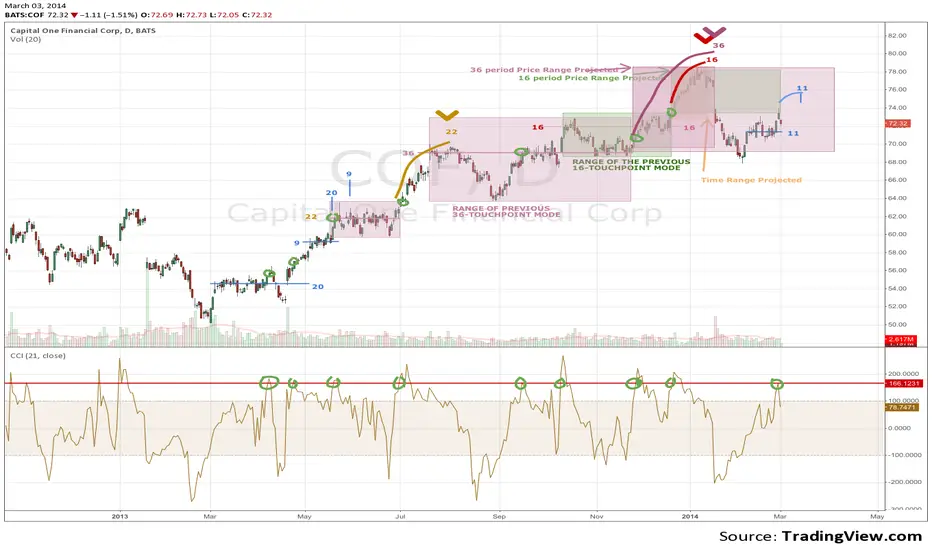
Capital One COF Daily Time at a Price Analysis I will outline why COF is a buy here, but a short at lower prices.
Here is another example of how to use 'Time at a Price" to determine trend.
Starting from the low last year in March there are some excellent examples of how time builds at a price and then projects "up" once there is a range that is above the mode or frequent price of the consolidation.
In the first trend there are 20-days near the 55 level and once the market "disconnects" from the 55 level it continues on for 20 days up into the $62 level. Along the way, a 9-day mode is made and once that mode is surpassed, the market continues another 9-days up into the $63 level.
Once $62 is reached, it takes 22 days at one price to set-up the next advance that starts in early July. That rally continues almost exactly 22-days up near $70 a share.
It takes 36 days to set up another range. And just 1-day shy of the 36-days is when COF reported earnings and gapped down from near 77 down to near the 72 level. Note that the rally equaled the price range that the market was in while it was forming its mode at the 69 level (73-64 or 9 pts). Adding 9 pts range to the mode at 69 gives a nice target of 78 which it hits just before time expires. There is a 16-day mode at 72, which is above the 36-day mode at 69, and this sets up a target at 78 and time expired right at the high of the rally at the highest close.
Note that the correction started and pulled back to the major "time support" at the mode of 36-day at $69/sh.
The current bounce off of the 69 level has an uptrend with an 11-day mode at 71. That rally is only in its 2nd day here on Monday, March 3. Once 71 is broken, then the downtrend will be in force I will outline the decline that is then forecast in duration and in price.
For now, you can buy dips to 71 and target an exit at the 11-day marker labeled on the chart. Stop loss is 1 average range on this methodology. (I would suggest $1.50 stop from entry, suggest entry under $72). Target 74-75.
NOTE that I also labeled CCI levels of +166 that COF had reached on Friday, just for reference. Half the time it (the reading of +166, or 1.66 standard deviations above the 21-day moving average) is a top and half the time it is a continuation sign. What is different this time is that the current mode at 71 is BELOW the previous mode at 72, so there is some deterioration in the accumulation.
HOWEVER: IF COF TOUCHES 70, SELL SHORT, target (78-71 measurement = 7 points) 64. Measure 7 points down from 71-mode. Stop loss on the short is 2.5 pts or 72.5.
Tim 2:19PM EST Monday, March 3, 2014
$COF Head & Shoulders COF started doing the dreaded H&s pattern when it had a retracement @68. Both shoulders are located @73 and the head @78.50.
on February 18th, it closed with an evening star at the 0.76 Fibonacci retracement level that if confirmed by lower lows and lower highs from the next bar is a bearish sign.
The MACD Histogram is forming a Peak and the Stochastics are at the Overbought level. This suggests a weakening momentum
If this fails to do a higher high on 19th, and theory matches reality then we can expect the price to fall below the neckline targeting at 57.

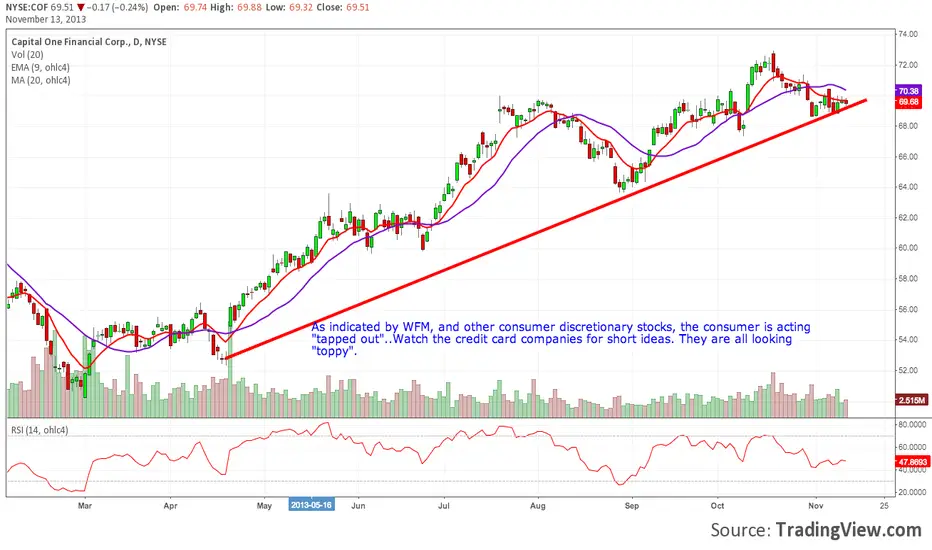

COF beginning a topping process.COF is showing signs of topping. Wait for a breakdown, and then a back test of the broken moving averages.
