Hello BullishHello Again, entered long for Compass Inc. with shown entry, SL and TP1 and TP2 points.
I see daily candle confirmation. along with expected incoming interest rate variation, I expect booming. Let's us. Compare my analysis to yours and take it on your own responsibility.
As usual, this is not a fi
Next report date
—
Report period
—
EPS estimate
—
Revenue estimate
—
−0.10 USD
−154.40 M USD
5.63 B USD
444.57 M
About Compass, Inc.
Sector
Industry
CEO
Robert Reffkin
Website
Headquarters
New York
Founded
2012
ISIN
US20464U1007
FIGI
BBG00J5SXTH3
Compass, Inc. engages in the provision of an online real estate platform. Its platform provides an integrated suite of software for customer relationship management, marketing, client service, operations and other critical functionality, as well as brokerage services and adjacent services. The company was founded by Ori Allon and Robert Reffkin in 2012 and is headquartered in New York, NY.
Related stocks

To know where you are, you need a Compass. Opendoor Technology's ( NASDAQ:OPEN ) recent surge (20x of lows) caused me to wonder what the theme is. After all, rarely is a movement motivated by nothing.
I've determined the only logical conclusion is the correlation of Real Estate to interest rates.
Opendoor is a REIT disguised as a tech
Compass well placed for US housing bounceCompass sits at the heart of the US residential real estate recovery. As housing demand rebounds, Compass stands to gain directly from rising activity. Its tech-enabled platform and scale afford it an edge when sellers return.
Slowing economic data and persistent high rates will eventually force th
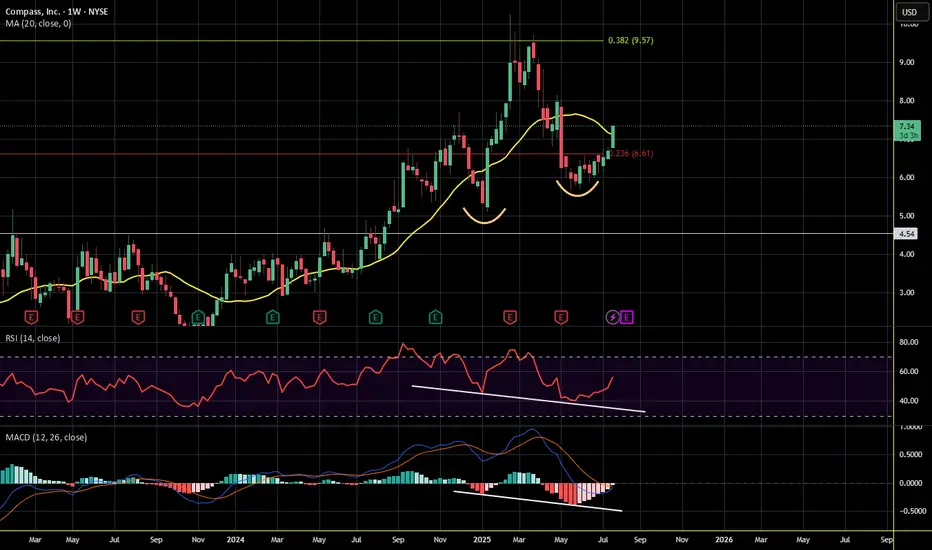
Bullish Hidden Divergence - COMP WeeklyDecent looking divergence on the weekly timeframe -- HIdden divergence on both MACD and RSI with higher lows in price
COMP/USD – 30-Min Breakout Trade Setup!📌
🔹 Asset: Compass, Inc. (COMP/USD)
🔹 Timeframe: 30-Min Chart
🔹 Setup Type: Symmetrical Triangle Breakout
📌 Trade Plan (Long Position)
✅ Entry Zone: Above $9.10 (Breakout Confirmation)
✅ Stop-Loss (SL): Below $8.60 (Break of Support & Triangle)
🎯 Take Profit Targets
📌 TP1: $9.61 (First Resistance

COMP/USD – 30-Min Long Trade Setup!📊 🚀
🔹 Asset: COMP/USD
🔹 Timeframe: 30-Min Chart
🔹 Setup Type: Bullish Wedge Breakout
🚀 Trade Plan (Long Position):
✅ Entry Zone: Above 10.23 USD (Breakout Confirmation)
✅ Stop-Loss (SL): Below 9.60 USD (Breakout Invalidated)
🎯 Take Profit Targets:
📌 TP1: 11.08 USD (First Resistance Level)
📌 TP2:

Symmetrical triangle on $COMP. Low Volatility ahead of earningsTechnical Setup: NYSE:COMP has shown lower highs and higher lows, forming a classic symmetrical triangle, suggesting potential for either a continuation of the current trend or a reversal.
Key Levels to Watch: Watch for a breakout above the upper trendline for a potential bullish move or a brea

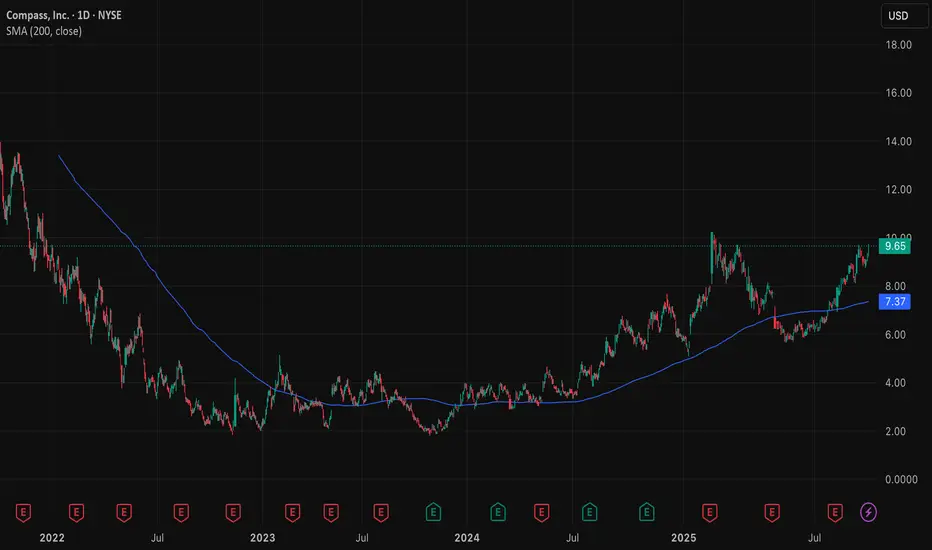
COMPASS Buy Set UpPrice bottomed out around 1.85 and reversed for a Daily uptrend. I have a Daily BOS so Im waiting for a Bearish candle to be bigger than the previous Bullish candle to begin the retest, then a continuation up towards 5.17 area

$compCan compass finally make a move after IPO? Was beat down during covid highs, beat down on interest rates, stock is down 90% since its public offering. Looks like it made a 100% move recently after hitting its 1.84 low... Stock looks like it is neutralizing- not sure how much longer the shorts can gr

COMP long
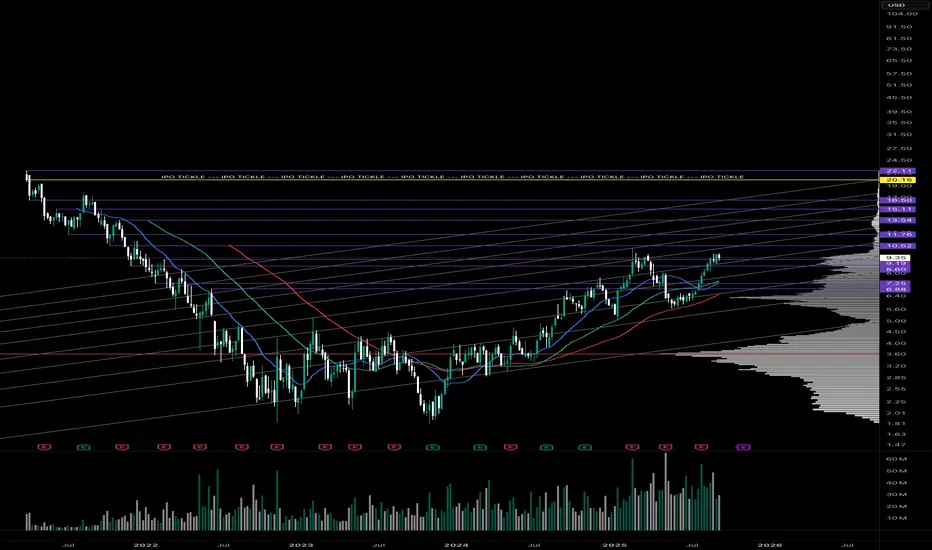
Price is down 85% from the top at $22
They have been dumping equity stakes onto their own agents for 2 years as a voluntary alternative to paying out commission. Many people have been burned leading to a class action suit (several over their history)
They have 3 quarters of cash left
They are d

See all ideas
Summarizing what the indicators are suggesting.
Neutral
SellBuy
Strong sellStrong buy
Strong sellSellNeutralBuyStrong buy
Neutral
SellBuy
Strong sellStrong buy
Strong sellSellNeutralBuyStrong buy
Neutral
SellBuy
Strong sellStrong buy
Strong sellSellNeutralBuyStrong buy
An aggregate view of professional's ratings.
Neutral
SellBuy
Strong sellStrong buy
Strong sellSellNeutralBuyStrong buy
Neutral
SellBuy
Strong sellStrong buy
Strong sellSellNeutralBuyStrong buy
Neutral
SellBuy
Strong sellStrong buy
Strong sellSellNeutralBuyStrong buy
Displays a symbol's price movements over previous years to identify recurring trends.
Frequently Asked Questions
The current price of COMP is 7.83 USD — it has increased by 3.71% in the past 24 hours. Watch Compass, Inc. stock price performance more closely on the chart.
Depending on the exchange, the stock ticker may vary. For instance, on NYSE exchange Compass, Inc. stocks are traded under the ticker COMP.
COMP stock has fallen by −0.76% compared to the previous week, the month change is a −11.82% fall, over the last year Compass, Inc. has showed a 28.57% increase.
We've gathered analysts' opinions on Compass, Inc. future price: according to them, COMP price has a max estimate of 11.00 USD and a min estimate of 7.00 USD. Watch COMP chart and read a more detailed Compass, Inc. stock forecast: see what analysts think of Compass, Inc. and suggest that you do with its stocks.
COMP reached its all-time high on Apr 1, 2021 with the price of 22.11 USD, and its all-time low was 1.82 USD and was reached on Nov 1, 2023. View more price dynamics on COMP chart.
See other stocks reaching their highest and lowest prices.
See other stocks reaching their highest and lowest prices.
COMP stock is 6.10% volatile and has beta coefficient of 0.88. Track Compass, Inc. stock price on the chart and check out the list of the most volatile stocks — is Compass, Inc. there?
Today Compass, Inc. has the market capitalization of 4.20 B, it has increased by 1.26% over the last week.
Yes, you can track Compass, Inc. financials in yearly and quarterly reports right on TradingView.
Compass, Inc. is going to release the next earnings report on Nov 5, 2025. Keep track of upcoming events with our Earnings Calendar.
COMP earnings for the last quarter are 0.07 USD per share, whereas the estimation was 0.07 USD resulting in a −3.26% surprise. The estimated earnings for the next quarter are −0.02 USD per share. See more details about Compass, Inc. earnings.
Compass, Inc. revenue for the last quarter amounts to 2.06 B USD, despite the estimated figure of 2.04 B USD. In the next quarter, revenue is expected to reach 1.79 B USD.
COMP net income for the last quarter is 39.40 M USD, while the quarter before that showed −50.70 M USD of net income which accounts for 177.71% change. Track more Compass, Inc. financial stats to get the full picture.
No, COMP doesn't pay any dividends to its shareholders. But don't worry, we've prepared a list of high-dividend stocks for you.
As of Oct 6, 2025, the company has 2.57 K employees. See our rating of the largest employees — is Compass, Inc. on this list?
EBITDA measures a company's operating performance, its growth signifies an improvement in the efficiency of a company. Compass, Inc. EBITDA is 63.90 M USD, and current EBITDA margin is 0.09%. See more stats in Compass, Inc. financial statements.
Like other stocks, COMP shares are traded on stock exchanges, e.g. Nasdaq, Nyse, Euronext, and the easiest way to buy them is through an online stock broker. To do this, you need to open an account and follow a broker's procedures, then start trading. You can trade Compass, Inc. stock right from TradingView charts — choose your broker and connect to your account.
Investing in stocks requires a comprehensive research: you should carefully study all the available data, e.g. company's financials, related news, and its technical analysis. So Compass, Inc. technincal analysis shows the sell today, and its 1 week rating is buy. Since market conditions are prone to changes, it's worth looking a bit further into the future — according to the 1 month rating Compass, Inc. stock shows the buy signal. See more of Compass, Inc. technicals for a more comprehensive analysis.
If you're still not sure, try looking for inspiration in our curated watchlists.
If you're still not sure, try looking for inspiration in our curated watchlists.