LVS trade ideas

$LSI Daily Chart $LSI daily chart:-
-----------------------
Bullish Sentiment:-
RSI is oversold 32%. Short Float is 3% reduced from 7% . 200 SMA is above the price line. Monthly is in uptrend, so a perfect swing.
Bearish Sentiment
Broke down the down channel. Its 4th leg, so it may go down further, 20 SMA crossed down to 200 SMA .
If I play this stock, I will buy it with a stop loss at $47.19 .
--This is my personal log

$LVS - Monthly Chart | Swing | Uptrend $LVS Monthly Chart , Next resistance will be at $66.75. The trend line and this resistance crosses this price, Also Fibonacci extension showing the near by price. It may form a double top around this price/ .
--. The Fibonacci showed in dashed line
-- This is s my personal opinion for my own log

Monthly chart for LVS ideaHere you can see LVS was trading on a bit of an incline headed into 2020, then covid happened of course and practically forced a double top at 81 and since then we have seen a lower high and another massive sell off in march followed by another lower high to confirm the trend. The play here is simple, calls if she holds ascending support, puts on a break and hold under support.

LVS week of 6/28Been waiting on LVS for a while now, looking at a possible multi week mover either way. Here on the 4hr we have a clean cut descending channel looking for a bounce off long term support, I have a feeling we will reach down to test one more time and I wouldnt be surprised if it touches or even breaks a few cents under 51.00. Super simple play, I am bullish on a break of 56.25 with volume. Bullish TPs on a break of 56.25 are 60, 64, 67, 70, 75 and 80. There is also a substantial bearish possibility that we see a massive dip as the stock has consistently hit lower highs on the monthly chart and a drop to 45 seems likely on a break of support at 50.50. My bearish TPs in the event of such a dip are equally as far out at 48, 45, 42, 40, 35 and 30. Places to watch for a reversal on a large dip are 47.50, 42.50 and 40. Link to monthly chart attached (Multi Week Plan)

good base here LVS is at the bottom of a channel and bounced pretty well off a CNBC pump
I think it can go up a lot higher to at least the top of the channel
if it breaks out target is $60
keep short term trades short term

LVS at support Las Vegas Sands has reached its weekly support line, good potential for a solid re open play. Hidden bullish divergence printing on the weekly, and bullish divergence printing on the lower timeframes such as the 4 hr. Good place to take a long. Target $70+

LVS Long IdeaLVS has been in a consolidation range for over 3 months. It is approaching a trend line that has been proven to be major support over the past year. I am looking for a breakout of this trading range to the upside. This stock moves fast when it gets a little momentum to the upside. It is currently trading below the 200 day MA, which in this market makes it somewhat of a value play.
Strategy:
Jan 2022 60 Calls (These contracts are trading with the lowest premium since they were originated)
Aug 2021 52.50/50 Put Credit Spread. Good risk to reward if it bounces and, gives plenty of time for the move to happen and collect a little theta decay.
Good luck trading!

LVS - Back in the Trading ZoneLVS
ENTRY = 53-55
Cost Avg Down = 48
1st Target = 58
2nd Target = 62
HODL Target = 68+
______________________________________________________________________________________________________________________
This content is for informational, educational and entertainment purposes only. This is not in any way, shape or form financial or trading advice.
Good luck, happy trading and stay chill,
2degreez


Las Vegas Sands - post pandemic watch list ideaLooks okay here, but $LVS might pull back if broader market pauses or enters downturn in early June.
Pivot points to note: S1 pivot is approximately $55.80; R1 is $59.20
YTD linear regression line currently at $61. Linear regression in uptrend which reflects recovery form late January sell-off.
I wouldn't describe it as drastically oversold at this level. For long-term investors, a half position at this time would be interesting.
I purchased shares in an IRA account because I felt my cash levels were too high.
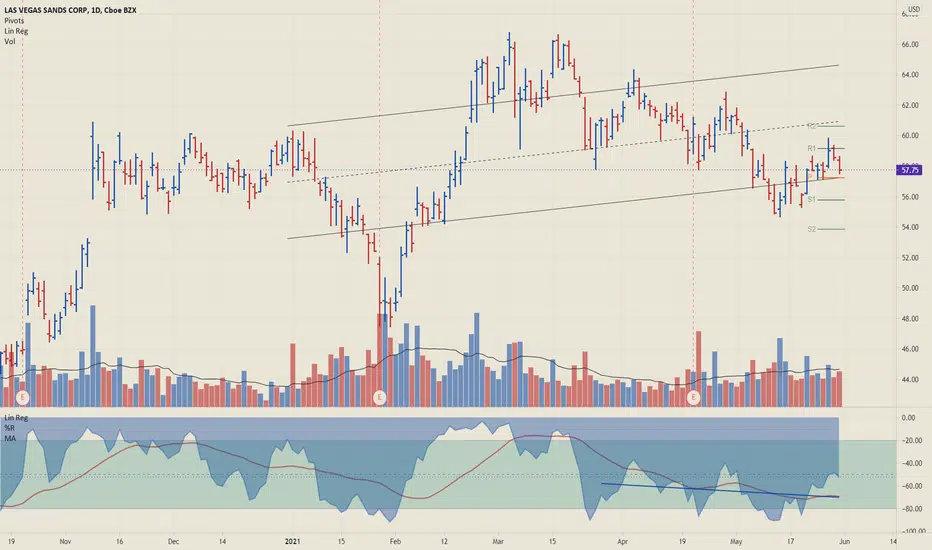

[Re-Publish] Technical Trade Setup: Las Vegas Sands (LVS)- The share has found support and rebounded off it's 200-day simple moving average .
- For conservative traders, a break of line A_B (channel resistance) triggers a buy/long (NB).
- Potential price path shown on daily chart .
Provisional Trade Levels:
Buy Range: $56.30-57. 40
Stop-loss: $53.40
Target Range: $65-$67
Consensus Price Targets:
Yahoo Finance: $68.58
Koyfin: $67.90
Wall Street Journal: $68.39

Technical Trade Setup: Las Vegas Sands (LVS)- The share has found support and rebounded off it's 200-day simple moving average.
- For conservative traders, a break of line A_B (channel resistance) triggers a buy/long (NB).
- Potential price path shown on daily chart.
Provisional Trade Levels:
Buy Range: $56.30-57.40
Stop-loss: $53.40
Target Range: $65-$67
Consensus Price Targets:
Yahoo Finance: $68.58
Koyfin: $67.90
Wall Street Journal: $68.39

Long | LVSNYSE:LVS
Possible Scenario: LONG
Evidence: Price Action
TP1~ 57.5
TP22 ~ 59
Call options, Strike 60$, 08/20/21
* This is my idea and could be wrong 100%.

LVSLONG-TERM: Bounce off 200 ma, falling wedge, classic bullish divergence, multiple supports. (not financial advice)

LVS bull put spreadSold the 55/54 put spread 8 dte for 20.5% ROI
Price into remnant demand behind 2 liquidity search spikes
Looks like a downward trending channel.
Spread is tucked at the distal side of next demand zone down which appears to be a higher timeframe zone.
Market is already making 2 strong bear moves down, so it'll have to keep extending to get the sold strike.
In theory the remaining demand zone at 57 plays enough defense to cause a small rally and get me over the finish line.

LVS Count still aliveLVS count is barely alive. Could be ready for a good run with minimal defined risk.


🎰 Las Vegas Sands : LVS - LONG, lets spin the roulette!!Hi mates is perfect setup for breakout of the big bullish flag NYSE:LVS
here is data for my trade:
------------------------Trade setup ---------------------------
Entry: 61.75
Stop Loss: 58.26
Profit target: 73.91
------------------------------------------------------------------
If you like the idea, do not forget to support with a 👍 like and follow.
Leave a comment that is helpful or encouraging. Let's master the markets together.

LVS Bull run PossibleLVS has a nice set up for a bull run. Maybe a good week for casinos. R/R is nice.

Bullish Triangles Across Reopening StocksFrom Las Vegas Sands to Live Nation Entertainment and many other stocks, bullish triangles keep popping up in "reopening" plays.
Notice how LVS clawed to a new 52-week high above $66 in early March, stalled and then pulled back to previous highs around $60. Also notice how it briefly tested under that level, along with its 50-day simple moving average (SMA), before quickly rebounding.
That price action now resembles an ascending triangle, with a series of higher lows and resistance around $61.25. This has the potential for upside continuation.
Similar activity appears LYV. The concert operator has also formed a set of higher lows while holding its 50-day SMA:
Hoteliers Hilton Worldwide and Marriott International have danced the same jig without even touching their 50-day SMAs:
Ditto for Norwegian Cruise Line , Royal Caribbean , MGM Resorts and Caesars Entertainment :
An ascending triangle also appeared in auto-parts supplier BorgWarner . It’s not exactly a reopening stock but it is the kind of cyclical value name that investors seem to like these days.
Overall these aren’t very glamorous stocks, but they are all showing similarly bullish patterns one quarter into the new year. Will they be the leaders in Q2?
TradeStation is a pioneer in the trading industry, providing access to stocks, options, futures and cryptocurrencies. See our Overview for more.
