SAVE getting ready for take offSAVE seems to be flagging on the 4HR setting up for a breakout above but it can still break down
SAVE trade ideas

SAVE update, save leaps will printSAVE update from when i charted months ago, not to late to add SAVE to your portfolio, still has the gap to fill and vaccines and stimulus is bullish news for airlines!

SAVE - weekly chartIt gave a buy signal after a 60% drop from the last sell signal
Buy and wait for a sell signal

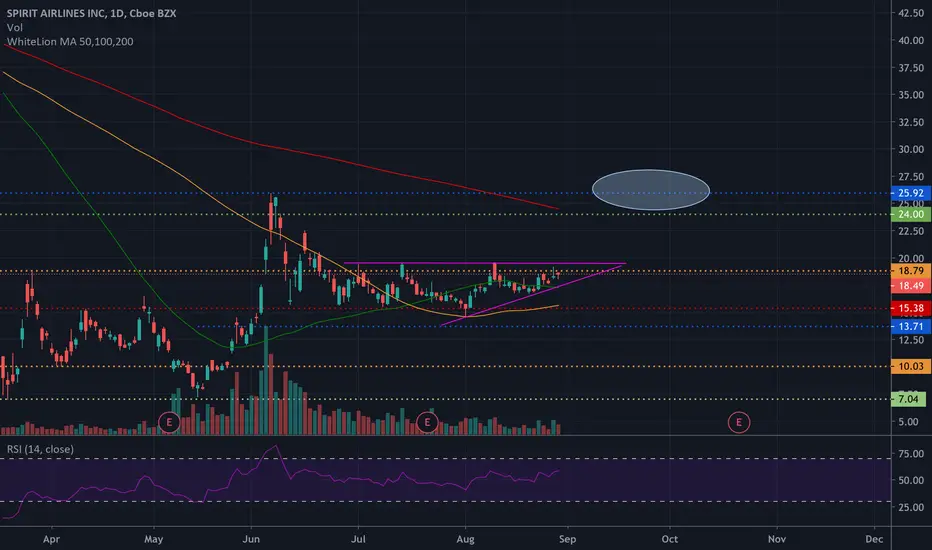
$SAVE Spirit Airlines Bullish Targets
Vaccine rally may take the Airlines higher today, first major target $30.00

Is it cheap? Why "dilution" is a concept you NEED to understandMany newbie investors get in trouble because they don't understand the relationship between share price and share count. If you're new to investing and you've never heard of "dilution," it's very important that you keep reading this post.
If I look at a standard chart of Spirit Airlines's share price, such as a upper chart above, I might conclude that the stock is cheap right now. Spirit shares are trading well below the price they've traded at for the last five years.
This is an illusion. The valuation of a company is its share price times the number of shares outstanding. When a company runs low on cash, it sometimes issues and sells new shares. This "dilutes" the ownership percentage of existing shares.
Imagine I have a pie, and I've invited you and two other people over for a piece. We're each going to get a quarter of a pie-- a really big slice! But then you decide to invite a friend. The size of the pie doesn't change, so now we have to cut it in fifths so your friend can have a slice. Each of us will get a smaller piece.
Issuing new shares works the same way. Since the beginning of the Covid-19 pandemic, Spirit Airlines has issued 29.14 million new shares, increasing its share count by 42.5%. That means that each share now represents a much smaller proportion of the company than it used to. The shares have been "diluted."
Because of dilution, looking at a chart of the price of a single share doesn't tell you how "cheap" or "expensive" a company is compared to its historical valuations. Fortunately, there's a quick and easy way to chart a company's actual valuation.
Share price multiplied by shares outstanding equals the company's total price tag, its "market capitalization" or "market cap." To chart market cap on TradingView, find and click the button labeled "fundamental metrics for stocks" at the top of the chart. Type "market" in the search box, and TradingView will narrow the list of metrics down to the one you want. Clicking on "market capitalization" will add a time series of the stock's market cap to your chart.
When we look at market cap for Spirit Airlines, it doesn't look cheap anymore. Spirit is trading within its price range of the last four years, even though the company is now financially worse off in every way. With earnings negative and sales nearly cut in half, Spirit is priced as if the pandemic had never happened. By charting market cap, you've adjusted for dilution and gained a much better understanding of the asking price.

possible return to the 43-48 dollar pivot range before Aug 2021However market indicates a downturn around that time

$SAVE Spirit Airways Trade setup for Tuesday 🚀🚀✈✈
Potential trade setup on a move above the Fibonacci Golden pocket.
Golden cross on moving averages Imminent .
Targets =
$23.52 Fibonacci retracement level.
$24.00 Monthly candle resistance
$26.00 June Pivot

keep your emotions checked!!Pitfalls go unseen when your nose is to the wind. Dont get stuck at the top.

Spirit Airlines: Short Trade JournalPlayed both sides of this trade, but the main position was on the short side. Hedged the upside at key price levels to build cashflow, sized up along the way as I started seeing confirmation moves. This trade went perfectly, I read this market very well.


ABC BullishPossible stop below 14.6 after long entry level is met with a clear uptrend
Good to focus on targets 1. T2 can be a while (o:
R above price so beware
Long entry can be at 16.10 but that does not get you over the R above. It depends on your preference
R will be encountered at gap down way up there at 38ish as well.
I feel if it gets above the closest R zone, it can go a ways. There will be R at B as well
There is also a S Triangle and an Ascending triangle. Break up from those would be 19.75
Symmetrical triangles can break either way, up or down
Short interest surprising very low and NV is increasing and if the government gives airlines more stimulus to keep going, who knows? Long term I think this is a good trade
Not a recommendation


spirit airlines looks like it's ready to flyfalling wedge appearing on the hourly & seeing hidden bullish divergence. assuming airlines get government aid, we should see a move up. bearish otherwise.

SAVE ANALYSIS and simple way to read Charts for beginnersI see SAVE going back to 25 by Jan 2021 but if you're an option trader i suggest getting ITM calls for 2021 even 2022 if you want to add to long term portfolio. Shares is also good to add to your stock portfolio. Remember to keep in mind if airlines were to shutdown and vaccine trials see no further progress that would be a sign to get out, but recent news looks good for airlines in general and this is an easy money printer here! hopefully momentum can carry us back to the ATH within the next 2-5 years at 85$. Imagine getting a 16$ call exp 1/2022 now and SAVE is back up at $50 ....

SPIRIT AIRLINES getting ready for a big moveSAVE consolidating for a few months now, sitting in this tight channel and could have a big move up or down! With airline activity picking up I'm swinging SAVE to 25$ by 01/21 ... Perfect to add to long term portfolio!
Simple way to read this chart, break that top purple zone (resistance) at $19.50 we will see an overall move to $25, break that bottom purple zone (support) at 14.80 we'll see an overall move to 10$


Spirit Airlines breaking down SAVE is breaking down from what was actually a constructive consolidation.
Targeting high 14s.

SAVE LONG TERM PLAY - 115% POTENTIAL UPSIDE$SAVE is looking to make another run, currently touching resistance at $19.50 levels. Once resistance is broken we will see an attempt to break June high's of $24-25.
From my TA it appears we are entering wave 3 of 5..
Current Target : $32.00
Current Price per Share : $17.70
Upside Potential : 115% Profit
STOP LOSSES:
$7.30 for LONG TERM
$15.30 for SHORT/MID TERM

$SAVE potential long-term 12345 elliot waveTesting my time-frame learning, hoping save will run again long term


Spirit Airlines approaching break out to wave 5 #SAVE looking to break out here. The Elliot cycle lines up pretty nicely, the technical indicators are favorable, holiday season is coming and there is possibly going to be some news of a vaccine from the CDC in the coming weeks.
All this points to a high probability trade setup.

Ascending Triangle ABC BullishNo rising wedges. Short interest very low surprisingly
Almost all of the travel stocks are in this same pattern. The ABC Bullish pattern is easy to spot. Stop goes under C.
Measure your AB leg and add it to B/O price, being aware of prior R and realizing there may be R at B. A stock can go further than this if market conditions are favorable. B/O price will be over the BC trendline and a confirmed up trend in place.
If you use fibonacci ratios, then you may want to try 0.62 of AB for target 1, then 1.27 of the AB leg. Then you have your PCZ (point of completion).
There is also an ABC bearish pattern. The ABC bullish structures are formed after a prolonged prior down trend or consolidation trends, whereas bearish ABC patterns are formed after a prior uptrend.
These are harmonic patterns and as crazy as the market may seem, there is symmetry to be found (o:
Not a recommendation