SE trade ideas


SE: Breakout is imminent I am very long this name right now. I think we see a significant breakout soon


SE breakingBreaking higher at end of day. See if it holds. Volume came in today. Will watch with a tight stop.


SE still tightSE still tight and I am still stalking. The R/R is there if the break higher comes. Will be watching.

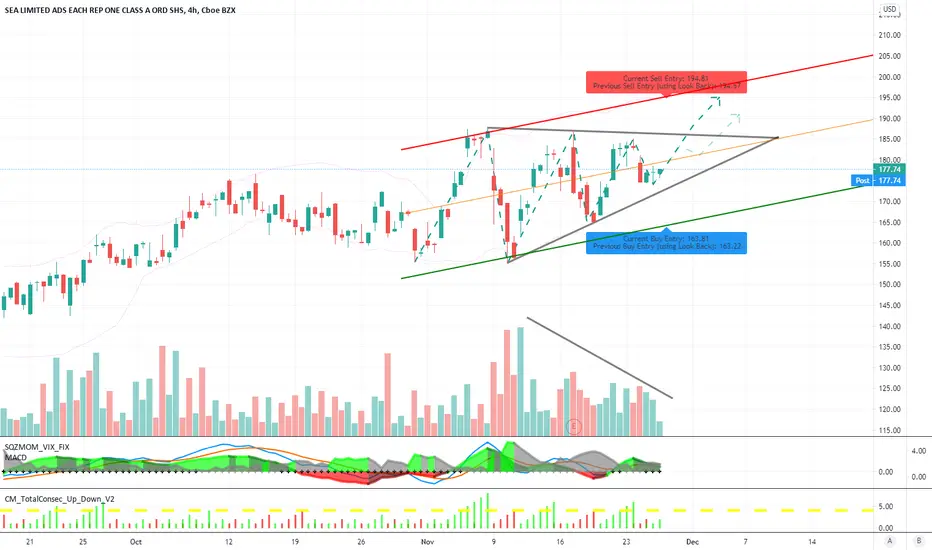
SE Trade Plan (12/2)-(12/18) Daily Chart - Bullish
4Hour Chart - Bullish
2Hour Chart - Bullish
1Hour Chart - Bearish
30Min Chart - Bearish
15Min Chart - Bearish
5Min Chart - Bearish
Short under @176.31
PT @173.77
PT @167.40
SL @177.54
Long over @177.54
PT @179.41
PT @182.09
SL @176.31


Sea Has a Bullish TriangleSea Ltd. Is one of the biggest companies people have never heard of – especially after this year’s big run from the $40s to the $180s.
The Singapore-based esports giant had a $90 billion market cap last week. That makes it comparable with Target (TGT) and CVS Health (CVS).
Trend followers may eye the chart for continuation higher into yearend. The first key feature is an ascending triangle that’s taken shape since early November. Roughly $187 is resistance at the top of the pattern.
Second, SE closed at $156.53 on November 10, slightly lower than its October 30 level. However, prices instantly snapped back the next session and have remained above those levels since, resulting in a false breakdown.
Third, the bounce occurred at the 50-day simple moving average (SMA), which SE has remained above since.
Finally, the stock has fought back above its 21-day exponential moving average (EMA) and stayed there for more than a week. That could be a sign it’s ready for another push higher.
TradeStation is a pioneer in the trading industry, providing access to stocks, options, futures and cryptocurrencies. See our Overview for more.


Blue Horseshoe loves SE limit @170Good fundamentals
Bullish flag on the daily chart
Growing e-commerce market in Asia
Buy limit @ 170
Time frame > 1yy

$SE Charting Patterns
SE appears to be consolidating into a bull pennant. Looking for buy opportunity near $170.00 and target $200.00 if it breaks out of the pennant.
Watching RSI and MACD to confirm bounce off 200 MA on the 30 day chart.
"I'm not an expert but I have watched a number of youtube videos"
NYSE:SE

SE ... Yes I seeEcommerce, Ewallet, Online gaming etc..
big benefactor of covid crisis. Now its setting up for a nice Swing trade. forming a double bottom on daily candlesticks, OBV, and MACD.
also position beautiful in the channel.. 187$ is entry with 220-230$ exit..


$SE with a neutral outlook following its earning releasePEAD is projecting a neutral outlook for $SE after a positive over reaction following its earning release placing the stock in Drift B
If you would like to see the Drift for another stock please message us. Also click on the Like Button if this was useful and follow us or join us.


SEA limited $SEI am long term bullish SE (SEA LIMITED). seems like sideways action with $10 range in next few days. Sellin $150 $155 naked puts and $185 Calls. these levels can easily be used to make IRON CONDOR.


** $SE GOING INTO EARNINGS ** 11/17 PREDICTION Video breakdown of what $SE could look like going into earnings!

SE Breaking down on big volume: Update on long term correctionThe past few days we have quickly slid off the highs printed on Friday on some pretty large bear volume. The bears have broken any trend line that the bulls may have had and broke it with the conviction that the bears want to see closing at the low of the day. We have had bearish divergence on both the daily and weekly charts building for months at this point so this correction is just getting started here.
The weekly chart has also broken its trend lines.
Monthly chart is currently forming a reversal candle with a large upper wick. RSI is still in the mid 94's even with today's pullback.
Targets remain $129.63 for first target, then $103.44 as the next target.
