Pattern of "head and shoulders" continues to be formed.Pattern of "head and shoulders" continues to be formed.
TEVA trade ideas
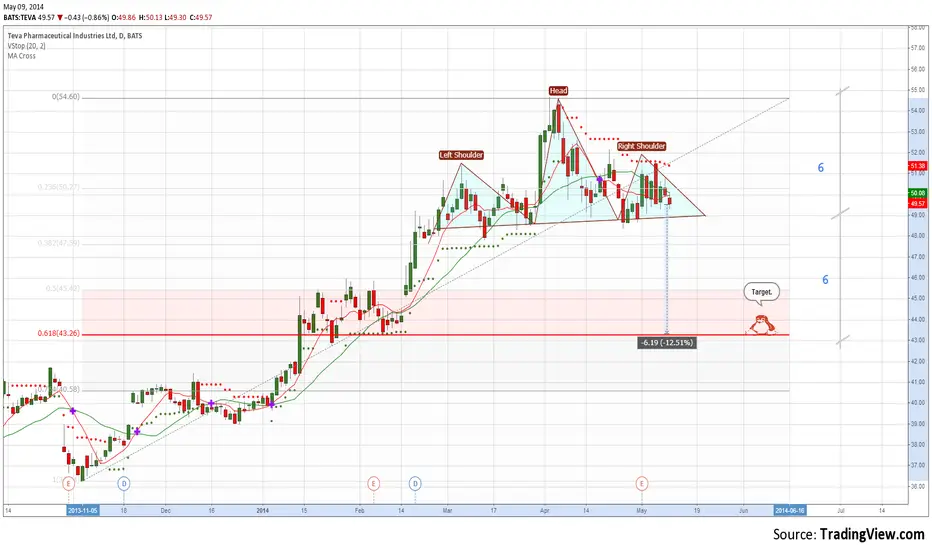
The correction is completed.First, we must wait for the breakout of the psychological level of 50. After that, wait for a signal from parabolic SAR.
This will mean that we now have a trigger on a short position.

Teva Pharmaceuticals TEVA Rally Time is Over and Sell SignalThe "time at mode" concepts are shown here:
A trend is when new highs occur every 5-days:
If above the "most frequent price" of a trend, then once above the mode the market can rally by the number of bars as are at the mode.
So, the "17" shows 17-days at one price and the projection is based on the price range from the first to the last bar that are touching those 17-days.
Another "16" day mode sets up and that time has expired after an initial overshoot of the target.
Now there is no new high for 5-days and a downtrend in place, but with only 8 days at a mode. If at the end of today, the price is below the red line, this becomes a sell signal with the targets labeled.
This is a great UPTREND that worked out very nicely with Soros buying a big position just ahead of the rally, but now that earnings are coming out in a few days, there is a chance that prices could soften ahead of the news. I'd suggest exiting prior to the earnings.
Cheers.
Tim 12:00PM EST 4/24/2014

TEVA PHARMA - TEVA - UPTREND BUYTEVA: UPTREND
It's hard to see the stock market correction when you look at this stock chart. TEVA has lagged the market for quite some time and it appears to be lifting from a minor correction.
Risk to 44 for short term traders:
Upside to 46.50 for short term:
Tim 1:53PM EST 2/5/2014
