NZDJPYit is my analysis to NZDJPY: I expect short from hear, potential selling zones, Imbalance and order block and premium area
NZDJPY trade ideas

NZDJPY | Buys | Swing TradeOANDA:NZDJPY
| Buyers in charge of bullish orderflow
| Rejecting of daily/4hr ZOI (Zone Of Interest)
| Will target next high (no structure)
| Reacting on the 1hr timeframe for shift
Status: Filled

NzdJpy is entering sell zoneLike all the Jpy pairs, NzdJpy was also affected by the BoJ verbal intervention and in this case, we have a drop of 300 pips.
After the sudden drop the pair started to recover losses and at this moment is approaching a strong sell zone.
Traders could look for weakness signs in this zone and the target could be set in the recent low zone.
Also, the 85.50 zone could offer a good target for swing traders

NZDJPY to see another stem dip?NZDJPY - 24h expiry
Price action has continued to trend strongly lower and has stalled at the previous support near 87.50.
The correction lower is assessed as being complete.
We expect a reversal in this move.
Risk/Reward would be poor to call a buy from current levels.
A move through 88.25 will confirm the bullish momentum.
We look to Buy at 87.50 (stop at 87.10)
Our profit targets will be 88.50 and 88.75
Resistance: 88.25 / 88.50 / 88.75
Support: 87.75 / 87.50 / 87.25
Risk Disclaimer
The trade ideas beyond this page are for informational purposes only and do not constitute investment advice or a solicitation to trade. This information is provided by Signal Centre, a third-party unaffiliated with OANDA, and is intended for general circulation only. OANDA does not guarantee the accuracy of this information and assumes no responsibilities for the information provided by the third party. The information does not take into account the specific investment objectives, financial situation, or particular needs of any particular person. You should take into account your specific investment objectives, financial situation, and particular needs before making a commitment to trade, including seeking advice from an independent financial adviser regarding the suitability of the investment, under a separate engagement, as you deem fit.
You accept that you assume all risks in independently viewing the contents and selecting a chosen strategy.
Where the research is distributed in Singapore to a person who is not an Accredited Investor, Expert Investor or an Institutional Investor, Oanda Asia Pacific Pte Ltd (“OAP“) accepts legal responsibility for the contents of the report to such persons only to the extent required by law. Singapore customers should contact OAP at 6579 8289 for matters arising from, or in connection with, the information/research distributed.

NZDJPY: BOJ continues to comment dailyNZDJPY: BOJ continues to comment daily
Over the past couple of days we have seen the BOJ cross the wires several times during the day sending some hawkish comments.
However, the market is still wary and tired of this situation considering that the BOJ has lied to the market several times about any possible intervention.
So far the USDJPY price reached 149.90 and we only saw comments.
Yesterday, the BoJ announced unscheduled bond-buying operation to stem surge in yields.. USDJPY was the only that didn't move a single pip. We saw that it moved on the opposite side.
Other XXXJPY pairs decreased by 150 to 250 pips.
This bearish wave may continue again after any small correction.
You may find more details on the chart!
Thank you and Good Luck!

NZDJPY | COULD BE A GOOD BUY!The 1-4 hour trend is technically bearish, however, we just broke the 4h 100 moving average with a solid bullish engulfing candlestick, our stoploss covers daily moving average, and 12 hour is developing a good price action. Overall I think the higher timeframe bias will continue and this short-term bearish movement should fade. 📈😊

NZDJPY LONG Market Structure Bullish on Higher Time Frames
Weekly And Daily AOI in the same area
Break out And Retest on the Weekly
Rejection On the Daily Time Frame
Around Psychological Level
88.6% FIB Retrecement
Strong Rejection Level on H4
Break & Retest of Resistance
REMEMBER: Trading is a Game Of Probability
: Manage Your Risk
: Patience Pays
: Every Moment Is Unique
: Rinse, Wash, Repeat!
: Stay Hydrated

#NZDJPY | Sell Opportunity | Potential 3.24 RR#NZDJPY | Sell Opportunity | Potential 3.24 RR
Some volatility yesterday led a to a continued breakdown a bounce is looking likely here although not one that will sustain. So continued downside is to be expected from here - we are just aiming for a good entry on this move. Await a nice confirmation reversal signal such as a bearish divergence and that should be enough to trigger a sell.
ENTRY | 88.159
TARGET | 87.469
STOP | 88.368
Disclaimer |
I am a day trader and do not enter these swing trades personally - these are merely publications of my ideas and analysis that conduct and share for free. Please consider your own investment your own responsibilty.

BluetonaFX - NZDJPY Rising Wedge SHORT IdeaHi Traders!
There is a rising wedge pattern on NZDJPY, which signals a possible reversal of the bullish trend we have seen over the past few months.
Price Action 📊
There was an aggressive upside price rejection candle followed by a momentum break below the 20 EMA. This shows that there may be new waves of bearish volume entering the market.
We are looking for a bearish break and a close below the support trendline.
Fundamental Analysis 📰
New Zealand left their interest rates unchanged, and the dovish statement from the RNBZ has left the NZD under some selling pressure.
Support 📉
87.094: PREVIOUS DAY'S LOW
Resistance 📈
89.251: PEVIOUS DAY'S HIGH
Risk ⚠️
No more than 2% of your capital.
Reward 💰
At least 4% of your capital.
Please make sure to click on the like/boost button 🚀 as your support greatly helps.
Trade safely and responsibly.
BluetonaFX

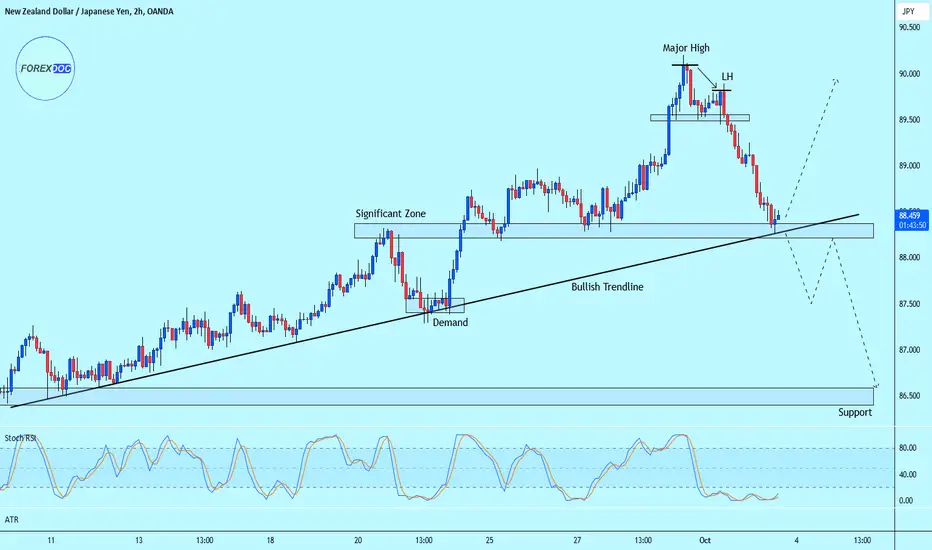
NZD/JPY Bearish PullbackAfter a very strong uptrend price has formed bearish pullback. It is currently testing confluence between bullish trendline and 883.400 zone. Here I marked two potential outcomes.
3 October 2023 - XTIUSD/USOIL/SpotCrude SellIn my morning prep stream, I had identified sells on XTIUSD as my best idea.
The trade has triggered now as buyers have retraced back up to an area close to key H1 sellers.
I am looking to trade down toward the next set of key buyers on the H4.

NZDJPY - BULLISH CONTINUATIONNZDJPY is in bull trend printing series of HHs and HLs. It has completed its correction making HL and bull trend is still intact. Long positions may be looked for.

Selling NZDJPY NZD/JPY has been fluctuating over the past few months.NZD/JPY has been in a downtrend since May 2023. However, the exchange rate has been showing a pullback opportunity recently, as the 61.8% Fibonacci retracement level lines up with a falling trend line on the hourly chart

NZDJPY ANALYSISMany novice and advanced traders try to complicate trading with complex strategies and indicators. In my experience, trading comes down to three simple things. Support. resistance and breakout. Add some knowledge on reversal ( for fakeouts) and continuation ( for breakouts) candlesticks and you are good. On NZDJPY, last week candle was extremely bullish on high volume. XXX/JPY pairs such as GBPJPY and USDJPY already broke out and I shared the ideas here .
What we are seeing on NZDJPY weekly candle is strong bullish momentum.

potential up trend I am watching this pair for a potential one more move before it turns for sell.
Buy and pay a close attention to any reversal. Good luck and happy trading.
Never trade blindly please use your own judgement. thanks.

NZD/JPYLooks like the Yen pairs across the board are giving us some setups in the near future. Just like CAD/JPY, I will be waiting for a continuation in the form of a three touch for a risk entry to take to the downside.

NZDJPY, Massive Triangle-Breakout, Pointing to Target-Zones!Hello There!
Welcome to my new analysis of NZDJPY. In recent times it has to be mentioned that there are only a few forex pair setups that have such a bullish potential as I have spotted it with NZDJPY. This is why I detected all the important price actions, underlying dynamics, and upcoming perspectives that should be primarily considered with NZDJPY. In fact, NZDJPY already emerged with a main entry setup however the reward potential is likely to increase once NZDJPY completes the whole formation.
The chart price-action is forming this important ascending triangle formation in which NZDJPY has the coherent wave count that is about to be completed within the upcoming times. Furthermore, NZDJPY has the main ascending trend line supports within the boundaries. The fact that NZDJPY is already building a breakout attempt with a bull flag on the local structures is increasing the scenario determination of the final breakout to emerge within the upcoming times.
Once NZDJPY has formed the final ascending triangle breakout above the upper boundary this is going to point to the expansion origin and is going to activate two main target zones within the whole development, the first target zone is within the 93.5 area and the second target zone is within the 97.5 area. When NZDJPY continues with the established dynamics from there on it also has the further ability to bounce into a new all-time high direction above these zones.
Thank you everybody for watching my idea about NZDJPY. Support from your side is greatly appreciated.
"Don't look for the needle in the haystack. Just trade the haystack!"
VP

NZDJPY: Great Trading Opportunity
NZDJPY
- Classic bearish formation
- Our team expects pullback
SUGGESTED TRADE:
Swing Trade
Short NZDJPY
Entry - 89.412
Sl - 89.941
Tp - 88.617
Our Risk - 1%
Start protection of your profits from lower levels
❤️ Please, support our work with like & comment! ❤️

NZDJPY Potential UpsidesHey Traders, in today’s trading session we are monitoring NZDJPY for a buying opportunity around 88.900 zone, NZDJPY is trading in an uptrend and currently is in a correction phase in which it is approaching the trend at 88.900 support and resistance area.
Trade safe, Joe.

🫖🔄Use This 3 - Step Rocket Booster Strategy🏆This strategy is meant to teach you
how to position yourself
for maximum profit
---
in trading stocks/forex/crypto
--
I was reading rocket stocks by Matthew .K
this is where i got the idea
--
and i got my inspiration to study more
from Tim Sykes
--
to trade as a beginner
you can find their books on Amazon
--
Later on today i was
working on my beats
if you dont know
--
Am actually a music producer
--
using a piano, synthesizer
and drums to make beats
--
i once read a book by
Donald Trump And Robert Kiyosaki
called MIDAS TOUCH
--
Inside that book
Trump said music artists
are very good
--
at trading Because the
markets move in a rhythm
what do you think?
--
I read this book when i was
really struggling with learning
how to trade
--
About 5 years ago
In this chart we are using the
ADX-DI Indicator
--
To make sure you do the following steps:
#1 - Price is above or below the 50 EMA
#2 - Price is above or below the 200 EMA
#3 - Price hits a New High or New Low
--
Bonus Tip
--
ADX Level should be more or equal to 25 level
--
The reason why am sharing this
with you is because i want your support
and encourage
--
If you have gotten value from this
please rocket boost this content
--
Disclaimer:
This is not financial advice please
do your own research.
Do not buy or sell
anything i recommend to you

NZDJPY The Target Is DOWN! SELL!
My dear friends,
Please, find my technical outlook for NZDJPY below:
The instrument tests an important psychological level 89.549
Bias - Bearish
Technical Indicators: Supper Trend gives a precise Bearish signal, while Pivot Point HL predicts price changes and potential reversals in the market.
Target - 88.577
Recommended Stop Loss - 90.099
About Used Indicators:
By the very nature of the supertrend indicator, it offers firm support and resistance levels for traders to enter and exit trades. Additionally, it also provides signals for setting stop losses
———————————
WISH YOU ALL LUCK

Beware of Shorting OpportunitiesAs we continue to analyze the market, it's become clear that avoiding bad trades is just as important as finding the next big one. This is particularly true when looking at the bottom 2 charts of NZDJPY's daily and weekly charts.
On the daily chart, we can see that the Bearish Deep Gartley Pattern is over-extended, meaning it took longer than expected to complete the trading setup. As a result, the market may not respect the level and could bash through the resistance level.
On the weekly chart, we also see that the Bearish Shark Pattern retest, doesn't give us an RSI divergence. Once again, the market may extend further before any significant retest.
Despite all of this, if you're still interested in shorting the market, do it with caution.
On the 4-hourly chart, waiting for the market to retest at the 90.03 level could attract price-action traders to jump in for the counter-trend move.
Personally, I prefer to head in for a buying opportunity at the key support level of 89.05. My initial stop-loss would be at 88.67 (-38 pips) or approximately -380USD/lot. The first target is seen at 90.08 (+103pips) or approximately 1,030USD/lot.
Remember, it's important to plan your own trade and never follow any trader blindly. Let's continue to monitor the market closely and make informed decisions.

NZDJPY Trading IdeaBased on Simple Technical Analysis ( Trendline + Support & Resistance )
Risk Disclaimer:
Please be advised that I am not telling anyone how to spend or invest their money. Take all of my analysis as my own opinion, as entertainment, and at your own risk. I assume no responsibility or liability for any errors or omissions in the content of this page, and they are for educational purposes only. Any action you take on the information in these analysis is strictly at your own risk. There is a very high degree of risk involved in trading. Past results are not indicative of future returns. Good luck :-)
