GER 30 - Expecting some bearish price action this week TVC:DEU40 GER30 is delivering bullish PAs inside a monthly imbalance so I am long term bullish. However, I am expecting some pullbacks into some discount.
DE30EUR trade ideas

Almost 10'000 Days of divergences for the DAX.1st July 1997. The DAX made a all time high RSI value of 92.98.
Ever since each high the DAX has made has had a price high whilst the RSI being considerably lower.
Ever so recently the DAX Made a double top with a lower histogram on the MACD indicator suggesting that momentum has slowed. With divergences on such a wider timeframe this usually means a change in momentum for quiet some time. MACD histogram being one of the strongest signals one can rely on. This suggest that the price of DAX index may suffer as the US economy heads into a recession. Germany already suffered from 3 consecutive quarters of Negative GDP Growth.
If this chart is correct and it is expected that the DAX will suffer further decline then a interesting comparison would be to compare the DAX/SPY to see if it is expected to overperform as a comparison.
Upon analyzing this comparison it has come to my attention that recently the DAX/SPY had bounce of the standard 2 deviation from its long term regression trend. As seen here.
More to my attention it currently has retraced to the local 0.5 Fibonacci Retracement Level
If it does not find support hear and follow through on its inverse H&S pattern due to US seasonality in markets it may just find support on its 2nd Standard deviation and still form a little less obvious H&S.
A recent example of this pattern was displayed in another major indices. The Nikkei 225.
However this comparison inclining was a result of the Nikkei inclining I do not expect the DAX/SPY comparison reverting to its mean as a result of this. Due to macro economic factors of less GDP expected for Germany and a slow down in the US Economy.
It may be expected that the DAX touches its second standard deviation one last time before the end of this market downturn. Which may lead to another yet but 25% retracement.


Let's just see what happensThe market is not giving any real signals and a real bull trend cannot be identified. But if I had to pay my rent tomorrow, then this would be a possible but definitely risky option

GER30 (DAX) - Short active ✅Hello traders!
‼️ This is my perspective on GER30.
Technical analysis: Here we are in a bearish market structure from daily perspective, so I am looking for a short position. I expect bearish price action from here as price filled the imbalance and rejected from bearish order block.
Like, comment and subscribe to be in touch with my content!


10112023 - #DAXDAX seemed to have gain strength as it is relatively strong yesterday; basing off the PZ and going to new highs. But US weakness resulted in DAX pulling back also.
Are we going to get a next leg down now? TBH US indices are more bearish and definitely oversold and thus many would likely be looking for further downside continuation today for US indices.
But IMO, DAX's closure yesterday is not bearish, or even somewhat bullish. Price is between PZ and DBZ, which is neutral to bullish. Overall, I would say to look for further upside; with 15195 as a low risk level to go long, for a move back to yesterday's high (15359) and even further to 15411.

DAX to turn into an uptrend?DE30EUR - 24h expiry
The bullish engulfing candle on the 4 hour chart the positive for sentiment.
Our short term bias remains positive.
The overnight dip has been bought into and there is scope for further bullish pressure going into this morning.
A break of yesterdays high would confirm bullish momentum.
Short term RSI is moving higher.
We look to Buy a break of 15301 (stop at 15201)
Our profit targets will be 15551 and 15601
Resistance: 15291 / 15400 / 15500
Support: 15180 / 15100 / 15068
Risk Disclaimer
The trade ideas beyond this page are for informational purposes only and do not constitute investment advice or a solicitation to trade. This information is provided by Signal Centre, a third-party unaffiliated with OANDA, and is intended for general circulation only. OANDA does not guarantee the accuracy of this information and assumes no responsibilities for the information provided by the third party. The information does not take into account the specific investment objectives, financial situation, or particular needs of any particular person. You should take into account your specific investment objectives, financial situation, and particular needs before making a commitment to trade, including seeking advice from an independent financial adviser regarding the suitability of the investment, under a separate engagement, as you deem fit.
You accept that you assume all risks in independently viewing the contents and selecting a chosen strategy.
Where the research is distributed in Singapore to a person who is not an Accredited Investor, Expert Investor or an Institutional Investor, Oanda Asia Pacific Pte Ltd (“OAP“) accepts legal responsibility for the contents of the report to such persons only to the extent required by law. Singapore customers should contact OAP at 6579 8289 for matters arising from, or in connection with, the information/research distributed.

GER30 H4 | Potential Bullish breakout?Price is testing the multi-swing high resistance level, and we could potentially see price taking out liquidity, and causing a breakout. Our buy entry is at 15274.4, which is a multi-swing high resistance level. Stop loss is at 15055.8, which is below the multi-swing low support level/double bottom. Take profit is at 15553.1, which is a swing high resistance level.
High Risk Investment Warning
Trading Forex/CFDs on margin carries a high level of risk and may not be suitable for all investors. Leverage can work against you.
Forex Capital Markets Limited (www.fxcm.com):
CFDs are complex instruments and come with a high risk of losing money rapidly due to leverage. 70% of retail investor accounts lose money when trading CFDs with this provider. You should consider whether you understand how CFDs work and whether you can afford to take the high risk of losing your money.
Stratos Europe Ltd, previously FXCM EU Ltd (www.fxcm.com):
CFDs are complex instruments and come with a high risk of losing money rapidly due to leverage. 74% of retail investor accounts lose money when trading CFDs with this provider. You should consider whether you understand how CFDs work and whether you can afford to take the high risk of losing your money.
FXCM Australia Pty. Limited (www.fxcm.com):
Trading FX/CFDs carries significant risks. FXCM AU (AFSL 309763), please read the Financial Services Guide, Product Disclosure Statement, Target Market Determination and Terms of Business at www.fxcm.com
Stratos Global LLC (www.fxcm.com):
Losses can exceed deposits.
Please be advised that the information presented on TradingView is provided to FXCM (‘Company’, ‘we’) by a third-party provider (‘TFA Global Pte Ltd’). Please be reminded that you are solely responsible for the trading decisions on your account. There is a very high degree of risk involved in trading. Any information and/or content is intended entirely for research, educational and informational purposes only and does not constitute investment or consultation advice or investment strategy. The information is not tailored to the investment needs of any specific person and therefore does not involve a consideration of any of the investment objectives, financial situation or needs of any viewer that may receive it. Kindly also note that past performance is not a reliable indicator of future results. Actual results may differ materially from those anticipated in forward-looking or past performance statements. We assume no liability as to the accuracy or completeness of any of the information and/or content provided herein and the Company cannot be held responsible for any omission, mistake nor for any loss or damage including without limitation to any loss of profit which may arise from reliance on any information supplied by TFA Global Pte Ltd.
The speaker(s) is neither an employee, agent nor representative of FXCM and is therefore acting independently. The opinions given are their own, constitute general market commentary, and do not constitute the opinion or advice of FXCM or any form of personal or investment advice. FXCM neither endorses nor guarantees offerings of third party speakers, nor is FXCM responsible for the content, veracity or opinions of third-party speakers, presenters or participants.

DAX Elliott Wave Analysis for Thursday 09/11/2023In the higher time frame, we are working on a wave ((2)) correction down. This wave ((2)) is unfolding as an ABC or WXY structure. The lower time frame favors a WXY structure. We are currently working on the wave X as an expanded flat structure. The wave ((c)) of this expanded flat does not look finished.


GER30 H4 | Bullish bounce off 50% fibo?Price could fall to our buy entry at 15009.3, which is a pullback support level, aligning with the 50% fibo retracement and slightly below the 61.8% fibo projection. Our stop loss is at 14896.5, which is below the 50% fibo retracement and 100% fibo projection. Take profit is at 15222.4, which is a swing high resistance level.
High Risk Investment Warning
Trading Forex/CFDs on margin carries a high level of risk and may not be suitable for all investors. Leverage can work against you.
Forex Capital Markets Limited (www.fxcm.com):
CFDs are complex instruments and come with a high risk of losing money rapidly due to leverage. 70% of retail investor accounts lose money when trading CFDs with this provider. You should consider whether you understand how CFDs work and whether you can afford to take the high risk of losing your money.
Stratos Europe Ltd, previously FXCM EU Ltd (www.fxcm.com):
CFDs are complex instruments and come with a high risk of losing money rapidly due to leverage. 74% of retail investor accounts lose money when trading CFDs with this provider. You should consider whether you understand how CFDs work and whether you can afford to take the high risk of losing your money.
FXCM Australia Pty. Limited (www.fxcm.com):
Trading FX/CFDs carries significant risks. FXCM AU (AFSL 309763), please read the Financial Services Guide, Product Disclosure Statement, Target Market Determination and Terms of Business at www.fxcm.com
Stratos Global LLC (www.fxcm.com):
Losses can exceed deposits.
Please be advised that the information presented on TradingView is provided to FXCM (‘Company’, ‘we’) by a third-party provider (‘TFA Global Pte Ltd’). Please be reminded that you are solely responsible for the trading decisions on your account. There is a very high degree of risk involved in trading. Any information and/or content is intended entirely for research, educational and informational purposes only and does not constitute investment or consultation advice or investment strategy. The information is not tailored to the investment needs of any specific person and therefore does not involve a consideration of any of the investment objectives, financial situation or needs of any viewer that may receive it. Kindly also note that past performance is not a reliable indicator of future results. Actual results may differ materially from those anticipated in forward-looking or past performance statements. We assume no liability as to the accuracy or completeness of any of the information and/or content provided herein and the Company cannot be held responsible for any omission, mistake nor for any loss or damage including without limitation to any loss of profit which may arise from reliance on any information supplied by TFA Global Pte Ltd.
The speaker(s) is neither an employee, agent nor representative of FXCM and is therefore acting independently. The opinions given are their own, constitute general market commentary, and do not constitute the opinion or advice of FXCM or any form of personal or investment advice. FXCM neither endorses nor guarantees offerings of third party speakers, nor is FXCM responsible for the content, veracity or opinions of third-party speakers, presenters or participants.

DAX to get back on the old tracks?GER40 - 24h expiry
Daily signals are mildly bearish.
Negative overnight flows lead to an expectation of a weaker open this morning.
A break of the recent low at 15070 should result in a further move lower.
Although the bulls are in control, the stalling positive momentum indicates a turnaround is possible.
Short term momentum is bearish.
We look to Sell a break of 15058 (stop at 15158)
Our profit targets will be 14808 and 14758
Resistance: 15150 / 15230 / 15270
Support: 15070 / 15000 / 14900
Risk Disclaimer
The trade ideas beyond this page are for informational purposes only and do not constitute investment advice or a solicitation to trade. This information is provided by Signal Centre, a third-party unaffiliated with OANDA, and is intended for general circulation only. OANDA does not guarantee the accuracy of this information and assumes no responsibilities for the information provided by the third party. The information does not take into account the specific investment objectives, financial situation, or particular needs of any particular person. You should take into account your specific investment objectives, financial situation, and particular needs before making a commitment to trade, including seeking advice from an independent financial adviser regarding the suitability of the investment, under a separate engagement, as you deem fit.
You accept that you assume all risks in independently viewing the contents and selecting a chosen strategy.
Where the research is distributed in Singapore to a person who is not an Accredited Investor, Expert Investor or an Institutional Investor, Oanda Asia Pacific Pte Ltd (“OAP“) accepts legal responsibility for the contents of the report to such persons only to the extent required by law. Singapore customers should contact OAP at 6579 8289 for matters arising from, or in connection with, the information/research distributed.

GERMAN40 BEARISH OUTLOOKGermany, a European economic powerhouse, is facing the threat of a technical recession as its industrial production, particularly in the automotive sector, has experienced a significant decline. In September, industrial production fell by 1.4%, surpassing the projected 0.4% drop, and the third quarter saw a 2.1% decrease in total production. The automotive industry, a crucial part of Germany's economy, reported a 5% drop in vehicle production from the previous month, alongside declines in other vital sectors like electrical equipment and pharmaceuticals. While there was a slight increase in factory orders for September, primarily due to large-scale orders and backlogs, economists remain cautious about the potential for future economic growth.
This economic downturn is worrisome for Germany, as it may be heading toward a technical recession, characterized by two consecutive quarters of economic contraction. Policymakers and economists are likely to closely monitor the situation and may consider measures to support the economy, such as fiscal stimulus or incentives to boost consumer spending and business investment. However, the situation is not isolated and may be influenced by global economic trends and factors, making it essential to keep an eye on international economic developments to gauge Germany's economic prospects in the coming months.
On a technical note, the daily graph had produced an Evening Star pattern that is reliable pattern for a downtrend. RSI is still on the neutral site, but MACD is already showing sell signals.
If this trend continues the price might reach levels of 14 977.5. In the opposite scenario the price might reach levels of 15 315.21
Risk Disclosure: Trading Foreign Exchange (Forex) and Contracts of Difference (CFD's) carries a high level of risk. By registering and signing up, any client affirms their understanding of their own personal accountability for all transactions performed within their account and recognizes the risks associated with trading on such markets and on such sites. Furthermore, one understands that the company carries zero influence over transactions, markets, and trading signals, therefore, cannot be held liable nor guarantee any profits or losses

DAX Elliott Wave Analysis for Wednesday 08/11/2023In the higher time frame, we are working on a wave ((2)) correction down. This wave ((2)) is unfolding as an ABC or WXY structure. The lower time frame favors a WXY structure. We are currently working on the wave X as an expanded flat structure. The wave ((c)) of this expanded flat does not look finished.

DAX Short Trade Looking to short the Dax from around the 15350 area.SL 110 Points. Taking profit at 2R & 3R.
My confluences here are,
Third touch of a trendline
Multiple Daily EMA's & MA's
If this trade fails immediately and price goes through my entry and breaks the trendline my next area for a short is the wick/Intra KL present on the chart above the first zone. I will short this till the trendline as a break of this could mean more upside before falling deeper.

Dax Short Term Buy IdeaH4 - Bullish convergence.
Currently it looks like a pullback is happening.
No opposite signs.
H1 - Bullish trend pattern.
Currently it looks like a pullback is happening.
Until the strong support zone holds I expect the price to move higher further after pullbacks.

GER30 Price was failedGER30
NEW forecast
Hello everyone, The price was failed, declined and stabilized under a motive force line which is 15130
so trading under that line will support the price to get 15020
maybe, after the price reached that line, like retest, from there again will start to be uptrend till 15130 and continue in uptrend
closing 4H candle above 15130, It will back to the upward trend

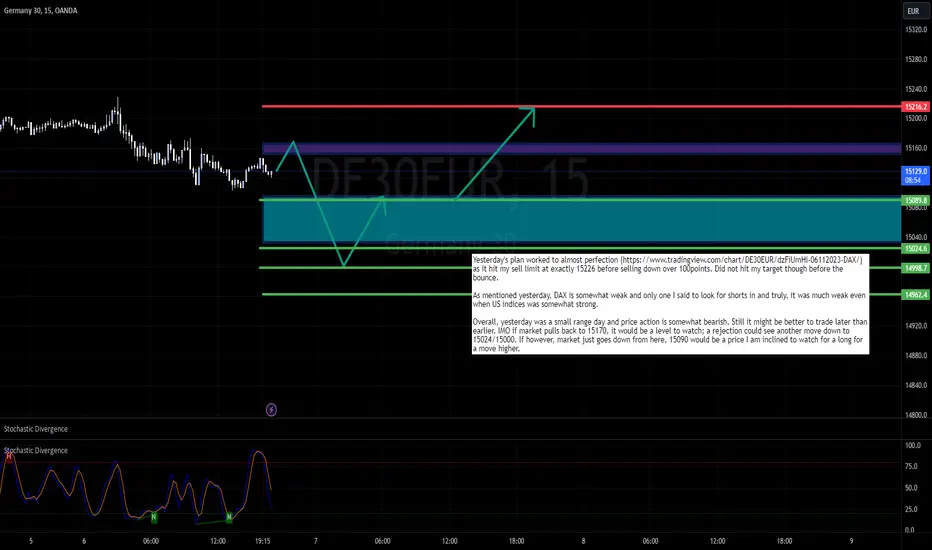
07112023 - #DAXYesterday's plan worked to almost perfection () as it hit my sell limit at exactly 15226 before selling down over 100points. Did not hit my target though before the bounce.
As mentioned yesterday, DAX is somewhat weak and only one I said to look for shorts in and truly, it was much weak even when US indices was somewhat strong.
Overall, yesterday was a small range day and price action is somewhat bearish. Still it might be better to trade later than earlier. IMO if market pulls back to 15170, it would be a level to watch; a rejection could see another move down to 15024/15000. If however, market just goes down from here, 15090 would be a price I am inclined to watch for a long for a move higher.
GER 30 ShortConfluence
1. Daily Ichimoku Conversion line below the base line indicating for bearish direction.
2. Weekly Ichimoku also suggest bearish nature
2. 61.8% Retracement co-inside with trend line.
3. The situation in the Middle East can get worse which might push stocks down.

GER30 Did their retest GER30
NEW Forecast
The price did their retest and now will start to reversed to up again
the price is trading above resistance line which is 15155, so as long as treading above that zone, it will get the next target 15275.
otherwise, if fall and stabilized under 15155 also under it 15020, gradually losing its positive momentum clearly to support the continuation of the proposed downward trend.

