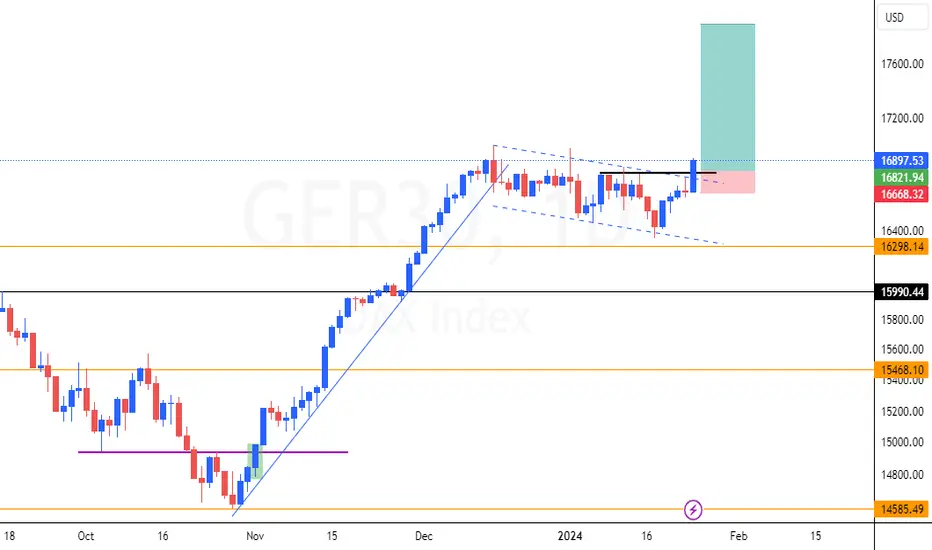
Ger30 short . Rising wedge formed on H4 timeframe
. Bearish engulfer formed on resistance on H1 / H4 timeframe
. RSI shows an overbuy and a double top on H4 timeframe
.
DE30EUR trade ideas

Weekly Technical Analysis 29/01/2024Start your week by identifying the key price levels and trends.
The SpreadEx Research team has analysed the most popular markets, including stocks, indices, commodities & forex.
----------------------------------------------------------------------------
Support & Resistance are set by the StdDev #2 Lower and Upper respectively.
Momentum is determined by the RSI level (70 as overbought and under 30 as oversold).
Analysis
Germany 40 is in the impulse phase of a bullish trend, with its current price positioning above the 20-period VWAP of 16,673. The index finds its support at 16,404 and faces resistance near 16,942. The RSI stands at 62, indicating a strong upward momentum.
UK 100 is in a potential reversal of a bearish trend, with the price breaking back above a declining 20-period VWAP of 7,556.. The index has its support level at 7,394.4 and resistance at 7,718.4. The RSI is noted at 57, suggesting a potential for further downside within the mark-up phase, indicating early signs of weakness.
Wall Street is in an impulsive phase of a bullish trend, indicated by its price well above the 20-period VWAP of 37,647. The support for this index is at 37,136, with resistance slightly above the current price at 38,157. The RSI is at 65, pointing towards strong bullish momentum without yet getting overbought.
Brent Crude is in the impulsive phase of a bullish trend, with its price well above the 20-period VWAP of 79.03. It has established support at 74.65 and is testing resistance at 83.30, closely matching its current price. The RSI is at 66, indicating bullish momentum, suggesting continued upward price movement.
Gold is in a corrective phase of a bearish trend with its price just below the 20-period VWAP of 2,030. The support level is set at 2,007, with resistance at 2,053. The RSI at 48 indicates a neutral momentum, suggesting that the market might be gathering strength for a potential directional move.
EUR/USD is showing a bearish trend, with the price below the 20-period VWAP of 1.0904. The support is found at 1.0813, and resistance is at 1.0995. The RSI at 39 indicates a lack of strong momentum but leans towards a bearish bias.
GBP/USD presents a neutral trend, hovering around the 20-period VWAP of 1.2708. The support and resistance levels are closely set at 1.2652 and 1.2768, respectively. The RSI is at 51, indicating a balanced market condition, suggesting uncertainty and lack of a clear directional trend.
USD/JPY is in the impulsive phase of a bullish trend, with its price above the 20-period VWAP of 146.64. The support level is at 143.54, with resistance at 149.73. The RSI is at 63, suggesting strong bullish momentum, indicating the potential for continued upward movement.

Will DAX find buyers at 78.6% pullback?DE30EUR - 24h expiry
Price action continues to trade around the all-time highs.
The primary trend remains bullish.
We look to buy dips.
20 4hour EMA is at 16865.
Levels close to the 78.6% pullback level of 16863 found buyers.
We look to Buy at 16865 (stop at 16785)
Our profit targets will be 17065 and 17125
Resistance: 16970 / 17004 / 17100
Support: 16890 / 16800 / 16750
Risk Disclaimer
The trade ideas beyond this page are for informational purposes only and do not constitute investment advice or a solicitation to trade. This information is provided by Signal Centre, a third-party unaffiliated with OANDA, and is intended for general circulation only. OANDA does not guarantee the accuracy of this information and assumes no responsibilities for the information provided by the third party. The information does not take into account the specific investment objectives, financial situation, or particular needs of any particular person. You should take into account your specific investment objectives, financial situation, and particular needs before making a commitment to trade, including seeking advice from an independent financial adviser regarding the suitability of the investment, under a separate engagement, as you deem fit.
You accept that you assume all risks in independently viewing the contents and selecting a chosen strategy.
Where the research is distributed in Singapore to a person who is not an Accredited Investor, Expert Investor or an Institutional Investor, Oanda Asia Pacific Pte Ltd (“OAP“) accepts legal responsibility for the contents of the report to such persons only to the extent required by law. Singapore customers should contact OAP at 6579 8289 for matters arising from, or in connection with, the information/research distributed.

GER30We will be looking for buying opportunities when the market reach the Uptrending Support of the bullish trend

DE trade set up idea for 28Jan - 2FEBDE trade set up idea for 28Jan - 2FEB
Looking to buy on DZ 1h & over


a weekly price action market recap and outlook - daxGood morning and i hope you are well.
This week bulls took over again and nasdaq e-mini futures printed a new all time high. After last Thursday and Friday, which gave good looking buy signals, this weeks follow through was expected. As mentioned during the week, i don’t expect much higher prices and that we will form a top here before we trade down over the next months. That does not mean, that markets can’t make higher highs. I just think the probability of that is low. That’s why i started taking longer term short positions in dax and nasdaq, to which i will add higher and take profits when appropriate.
dax
Quote from last weeks outlook:
Let’s talk bull case first: Bears could not produce lower prices or big consecutive bear days below the 20ema. Bear channel held and bulls just bough everything under 16700. Bears tried 3 times and now they will probably give up to short higher again. Thursday and Friday printed consecutive bull bars and it’s a buy signal. They want a retest of the ath or at least trade back to upper channel lines.
Market did exactly that and we even broke above the bear trend line. I still think this is a trading range and two legged moves are common. We might retest the previous January high at 17123 and depending of the strength of that, could also retest the ath but i highly doubt we can break it. Highest odds for me are that this is a lower high and i just have to adjust the bear trend line. For next week i expect a weaker overall (if earnings do not surprise upwards big time) market and bears trying to print lower lows. If the bears are strong, we could trade back to the lower bear trend line at around 16200. Everything below would be a surprise, as well as prices above 17200.
outlook last week: “probably up“ → good outlook, was good for 300 points
short term: sideways to down
medium-long term: down - what would change that? two consecutive daily closes above 17300

DAX Elliott Wave Analysis for Monday 29/01/2024In the higher time frame, it looks like we started a new upward cycle from the October low. This means the wave ((2)) low is in after an expanded flat. The alternative scenario assumes a wave (2) low of a lower degree. In the lower time frame, the primary scenario suggests that wave 4 as a WXY structure is in.

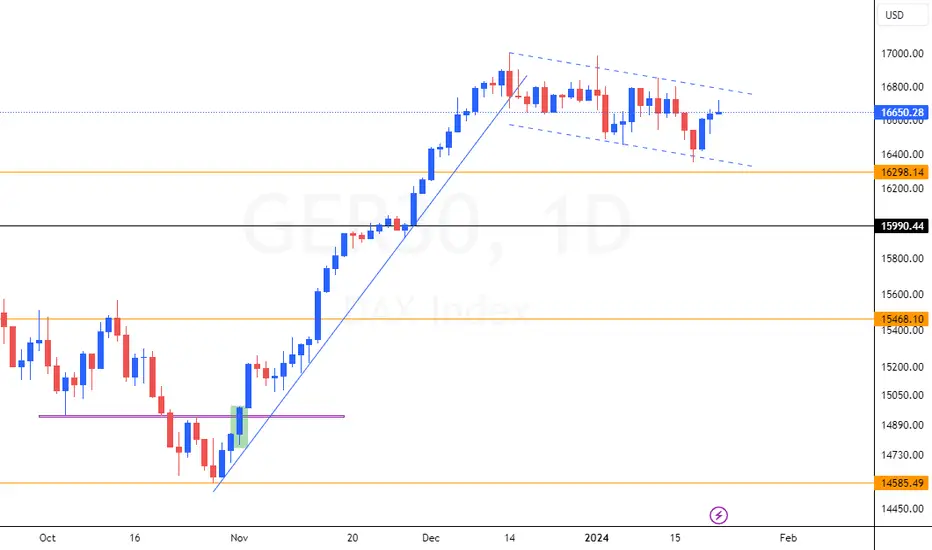
DAX, is 17k the top?As you may noticed, after reaching the round 17k level, the DAX reacted more corrective than usual and fell back to the trend line. If you want to get in a short position, you can look for the trend line to be broken and retestet. This move could be interpreted as a 1, 2 setup for a decline back to the 16k area.

GERMANY 40 BUYTrying this buy.
Good risk/reward.
Probable trend reversal.
I go in staggered on the 2 fibonacci levels, with same stack, trying to optimize entry.
Do your own research.
No financial advice. Be cautious.

✅DAX BULLISH BIAS|LONG🚀
✅DAX is trading in an
Uptrend and the index has
Formed an opening wedge
Pattern so IF we see a
Bullish breakout then we
Will be expecting a
Further move up
LONG🚀
✅Like and subscribe to never miss a new idea!✅

GER 30 : More long orders are setting up for potential bull run A strong daily bullish close above the bull flag resistance would signal bullish rally continuation.
DAX // primary expansionA countertrend on H1 was broken by a nice trigger candle that is visible on H4 as well, near the all-time high.
At the moment, this long impulse's correction on H1 is valid, but if it breaks before the H4 TREND and the Daily TREND is broken, we can witness a very nice move towards the target zone.

The extension of the Bull marketDear Friends,
I hope this message finds you well and that you're having a great start to the week. I wish you success in your business endeavors.
As someone interested in the Elliott Wave principle, I find it a valuable tool for analyzing the market. I have developed my approach by combining this principle with my personal experience and by considering various scenarios that are likely to occur in the market.
I am sharing my analysis with you, but please note that I am not providing any buy or sell signals. I aim to share my unbiased analysis with you so that you can use it as a guide to make informed decisions.
The first analysis is Litecoin
In the attachment, you will find my previous analysis of the same market, so you can compare and see the differences. All the details of my analysis are clearly labeled, making it easy for you to understand (although having a basic familiarity with the Elliott Wave Principle theory will help you understand the analytical idea more easily).
I have been studying the Elliott Wave principle for almost three years now. With time, my understanding of this knowledge and experience has increased. What I have achieved so far is a legacy of a genius named Ralph Nelson Elliott, and I am truly satisfied with my progress. May his soul rest in peace and his memory be cherished.
Thank you for your support so far. I am grateful and will always remember your kindness. Please feel free to share your thoughts and feedback with me.
I hope my analysis will be useful to you in your business journey, and I wish you all the best.
Sincerely,

SHORT IDEAPrice rallied up yesterday after the London Sessions following high impact news drivers.
I'm anticipating a retracement lower to possible correct the move higher, and a possible reversal later in the day.
Targeting the lows and taking partials at the annotated key levels and the consolidation area.
Annotations and stops made in the chart.
As usual, manage risk and conserve capital.

DAX at Resistance - again... - German economy is not in its best condition ever, no signals for rapid change in this matter
- hiper optimism is still present out there and no signals it is going anywhere
- technical levels work only if many traders observe them,
- technical levels dont work if traders just buy without giving it a single thought - which is happening right now
- thus this technical level will most likely be broken and DAX will add more gains...
But you can keep in mind, that technical resistance @ 16950 is created by two Fibo Ext levels:
* FE 61.8 of the impulse starting at the bottom of pandemia (green)
*FE 0.5 of the impulse starting on Oct 22 2022 (yellow)
Do you thing DAX will respect this resistance or it will ignore it?

DAX Elliott Wave Analysis for Thursday 25/01/2024In the higher time frame, it looks like we started a new upward cycle from the October low. This means the wave ((2)) low is in after an expanded flat. The alternative scenario assumes a wave (2) low of a lower degree. In the lower time frame, the primary scenario suggests that wave 4 as a WXY structure is in.

SHORT IDEAAnticipating a move lower to the anticipated targets.
Stop at 16812.1
Key anticipation: we have several news drivers in the London Session which could possibly prompt as reversal.
Annotations made in the chart.
Once the stop level of 16812.1 is taken, the idea is invalidated.
As always, manage risk and conserve capital.

GER 30 Day chart Potential Bull flagA strong bull breakout could interest buyers for bull run continuation.
DAX Elliott Wave Analysis for Wednesday 24/01/2024In the higher time frame, it looks like we started a new upward cycle from the October low. This means the wave ((2)) low is in after an expanded flat. The alternative scenario assumes a wave (2) low of a lower degree. In the lower time frame, the primary scenario suggests that wave 4 as a WXY structure is in.

The DAX could be at (or near) a swing lowIndex futures held their ground overnight, and the US dollar's rally is showing signs of near-term exhaustion. And that indicates a subtle change in sentiment ahead of today's open.
The DAX found support at its 50day EMA on Wednesday, which is just above the 2021 high. Given a small-ranged bullish hammer formed alongside higher volume suggests a 'change in hands' between sellers to buyers, so we're on guard for a bounce.
Bulls could seek to enter within yesterday's range with a stop beneath the 2021 high and initially target gap resistance around 16,490 - a break above which brings 16,600 into focus for bulls.
However, as we suspect the US dollar is set to extend its gains after a pause in its rally and that equities are yet to make a decent retracement, we're anticipating another leg lower towards the support zone just above 16,000.

a daily price action after hour update - daxGood evening and i hope you are well.
After such strong rallies, markets tends to form trading ranges instead of another trend in whatever direction. So today, we chopped back and forth. Which is bad for the bears because that means acceptance of higher prices. Only question is then, how high? Most indexes have obvious targets above, which i gave in my weekly outlook. I also said market is currently bullish and today further confirmed my thesis.
dax
Dax is inside a big triangle from the recent bull trend and the upper bear channel visible on the daily chart. Today was uneventful since we close 9 points above the open price. The tricky thing on a day like today is, that the 2 to 3 legged moves inside the range look strong with good looking signal bars that just turn around at support & resistance, tricking traders into believing a breakout is about to happen. That’s just something will learn to read with hard earned experience. Nothing else.
short term: sideways to up
medium-long term: down
trade of the day: short from the open to globex gap close and test of fridays open and the long above bar 55 to todays open price. that could have been 150-200 points

DAX Elliott Wave Analysis for Tuesday 23/01/2024 (+ HTF)In the higher time frame, it looks like we started a new upward cycle from the October low. This means the wave ((2)) low is in after an expanded flat. The alternative scenario assumes a wave (2) low of a lower degree. In the lower time frame, the primary scenario suggests that wave 4 as a WXY structure is in.
