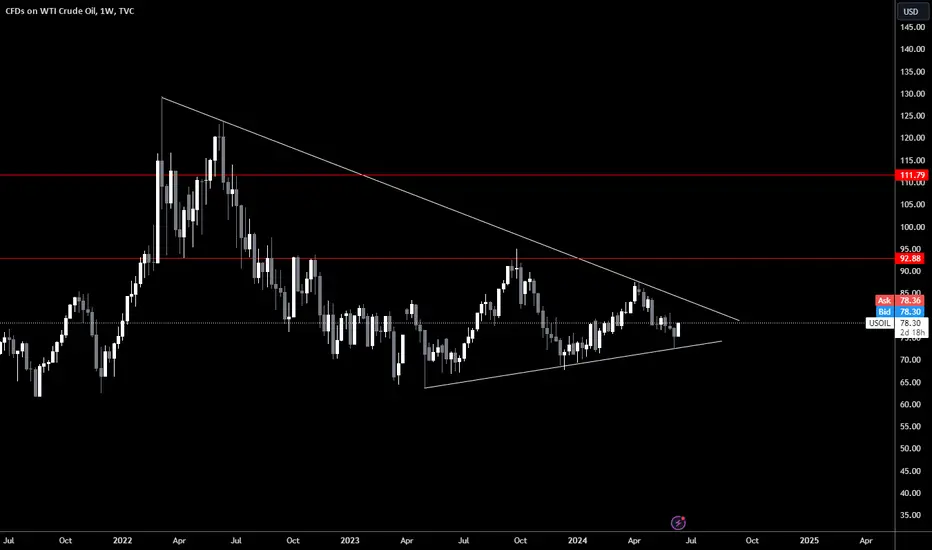
USOILHi guys,
In this chart i Found a Supply Zone in USOIL CHART for short entry,
Observed these Levels based on price action and Demand & Supply.
*Don't Take any trades based on this Picture.
... because this chart is for educational purpose only not for Buy or Sell Recommendation..
Thank you
OILUSD trade ideas


USOILAfter 7wks plus of waiting and even taking a loss now this guy seems to be respecting setup. in a couple of days our first TP should be hit.
VHT YOUR MENTOR SIGNING OUT


USOIL longUSOIL Trading Analysis and Strategy
Entry Price (EP): $77.85
Reason: Through the latest market trend analysis of USOIL, we can see the overall market trend from the 1day, 4hour, and 1hour charts. The 1day chart shows the market's overall trend, and the 4hour chart confirms the trading trend. The 1hour chart presents a short term short entry, stop loss, and take profit signals. We will wait for the reversal signal on the 1hour chart. Based on RSI Divergence data, the entry price is determined to be $77.85.
Stop Loss (SL): $76.62
Reason: Stop losses are calculated using ATR data,providing a margin of safety to limit potential losses if the market moves against the position.
Target Price (TP): $79.03
Reason: The take profit target is set based on ATR data analysis and market trend prediction, aiming to obtain potential profits from expected price changes.
Profit Potential in: $1.18 (11.80usd/lot)
Please note that Forex trading involves risks and the analysis provided is based on the information available. Market conditions can change rapidly, so it is important to stay current and consider implementing risk management strategies. It is crucial to monitor the market closely and adjust your trading strategy accordingly.

USOILRSI indicates Bearish Divergence. Which means that at any time the market trend can change to LL and LH.

USOil WTI Short 4Hour divergence- Trendline1. Market Analysis:
Asset: USOil (WTI Crude Oil)
Timeframe: 4-hour
Pattern: Bearish divergence identified
Additional Confirmation: Trendline resistance
2. Entry Criteria:
Divergence Confirmation: Identify bearish divergence on the 4-hour timeframe using indicators like RSI or MACD. Bearish divergence occurs when the price forms higher highs, but the indicator forms lower highs.
Trendline Resistance: Confirm that the price is approaching or touching a significant trendline resistance, which has been respected in the past.
3. Trade Setup:
Entry Point: Place a sell order near the trendline resistance once bearish divergence is confirmed and there is a rejection from the trendline. You can enter the trade at the close of a bearish candle that forms near the trendline resistance.
Stop-Loss: Set the stop-loss order above the recent swing high or slightly above the trendline to limit potential losses if the price breaks through the resistance.
Take-Profit: Determine your take-profit target based on key support levels or a favorable risk-reward ratio. Consider using a risk-reward ratio of at least 1:2 to ensure that potential profits outweigh potential losses.
4. Risk Management:
Position Size: Calculate your position size based on your risk tolerance and the distance between your entry point and stop-loss level. Ensure that you only risk a predetermined percentage of your trading capital per trade (e.g., 1-2%).
Risk-Reward Ratio: Aim for a risk-reward ratio of at least 1:2 or higher. This means if your stop-loss is 50 pips above your entry, your take-profit should be at least 100 pips below your entry.
5. Additional Confirmation:
Volume Analysis: Check for an increase in volume to confirm the validity of the bearish divergence and the potential for a strong downward move.
Support and Resistance: Ensure that the trade aligns with key support and resistance levels on higher timeframes (e.g., daily or weekly).
6. Trade Execution:
Place Orders: Set your sell order, stop-loss, and take-profit levels according to the above criteria.
Monitor the Trade: Keep an eye on the trade to manage it effectively. Adjust the stop-loss to break even or trail it as the trade progresses in your favor if necessary.
7. Review and Adjust:
Post-Trade Analysis: After the trade is closed, review the outcome to learn from the trade. Evaluate what worked well and what could be improved for future trades.
Example Trade Setup on TradingView:

WTI bull runHello traders! I am currently looking at oil. I noticed a strong trend line that it bounced off from. we can see it heading to 92.00 and eventually 111.00 drop a like if you agree. follow for more ideas. thanks.
Could price reverse from here?USO/USD is rising towards a resistance level which is an overlap resistance that lines up with the 78.6% Fibonacci retracement and could potentially reverse from this level to our take profit.
Entry: 78.92
Why we like it:
There is an overlap resistance level which lines up with the 78.6% Fibonacci retracement.
Stop loss: 80.80
Why we like it:
There is a pullback resistance level.
Take profit: 76.59
Why we like it:
There is an overlap support level which is slightly above the 38.2% Fibonacci retracement.
Please be advised that the information presented on TradingView is provided to Vantage (‘Vantage Global Limited’, ‘we’) by a third-party provider (‘Everest Fortune Group’). Please be reminded that you are solely responsible for the trading decisions on your account. There is a very high degree of risk involved in trading. Any information and/or content is intended entirely for research, educational and informational purposes only and does not constitute investment or consultation advice or investment strategy. The information is not tailored to the investment needs of any specific person and therefore does not involve a consideration of any of the investment objectives, financial situation or needs of any viewer that may receive it. Kindly also note that past performance is not a reliable indicator of future results. Actual results may differ materially from those anticipated in forward-looking or past performance statements. We assume no liability as to the accuracy or completeness of any of the information and/or content provided herein and the Company cannot be held responsible for any omission, mistake nor for any loss or damage including without limitation to any loss of profit which may arise from reliance on any information supplied by Everest Fortune Group.

USOIL: Elliott Wave AnalysisDetails: Wave 1 black (Cycle Degree) was completed at 67.68 as Impulse Wave and Wave 2 black (Cycle Degree) was completed at 87.60 as Double Zigzag. Wave 1 green (Primary Degree) was completed at 72.43 and prices have been developing and retracting to Wave 2 green (Primary Degree) as expecting target at Fibonacci Level 0.5-0.786
Invalidation Point: 72.43
Trading Opportunity: Wait for Wave 2 green (Primary Degree) complete and find a chance to entry the orders while price declines to Wave 3 green (Primary Degree)

USOIL Potential Downtrend Line Breakout At $78.21. 11.06.2024Potential downtrend line breakout in USOIL 1hr chart at $78.21.
If breakout holds:
Target 1: $79.78.
Target 2: $81.78 if $79.78 is broken.
If breakout fails:
Target 1: $76.97.
Target 2: $76.00 if $76.97 is broken.
Apply Risk Management
Risk Warning: Trading in CFDs is highly speculative and carries a high level of risk. It is possible to lose all of your invested capital. These products may not be suitable for everyone, and you should ensure that you fully understand the risks taking into consideration your investment objectives, level of experience, personal circumstances as well as personal resources. Speculate only with funds that you can afford to lose. Seek independent advice if necessary. Please refer to our Risk Disclosure.
BDSwiss is a trading name of BDS Markets and BDS Ltd.
BDS Markets is a company incorporated under the laws of the Republic of Mauritius and is authorized and regulated by the Financial Services Commission of Mauritius ( FSC ) under license number C116016172, address: 6th Floor, Tower 1, Nexteracom Building 72201 Ebene.
BDS Ltd is authorized and regulated by the Financial Services Authority Seychelles (FSA) under license number SD047, address: Suite 3, Global Village, Jivan’s Complex, Mont Fleuri, Mahe, Seychelles. Payment transactions are managed by BDS Markets (Registration number: 143350)
Disclaimer

OIL is testing a strong resistance zone. Be careful OIL is testing a strong resistance zone. Be careful of any bearish moves
From the previous analysis, OIL moved down from the megaphone pattern pointing down for a bigger bearish wave.
The price is already testing the base of the pattern indicating the possibility that it could go lower again.
This is just the beginning and should confirm the bearish movement and it is not a mus that it will move down.
You can pay attention to this area as oil may resume the bearish trend again.
You may find more details in the chart!
Thank you and Good Luck!
❤️PS: Please support with a like or comment if you find this analysis useful for your trading day❤️

OIL: Day 3 breakout trades long in the market, NFP week!Hi everyone and welcome to my channel, please don’t forget to support all my work subscribing and liking my post, and for any question leave me a comment, I will be more than happy to help you!
“Trade setups, not movements”
1. DAY OF THE WEEK (Failed Breakout, False Break, Range Expansion)
Monday DAY 1 Opening Range
Tuesday DAY 2 Initial Balance
Wednesday DAY 3 (reset DAY 1) Mid Point Week
Thursday DAY 2
Friday DAY 3 Closing Range ✅ no daily cycle
2. SIGNAL DAY
First Red Day
First Green Day
3 Days Long Breakout ✅
3 Days Short Breakout
Inside Day
3. WEEKLY TEMPLATE
Pump&Dump
Dump&Pump ✅
Frontside
Backside ✅
4. THESIS:
Long: primary, day 3 long in the market, OIL looks like coiling for an explosive move. After NFP I will looking for a buy low dump and pump back either the HOW, or the breakout NY session of monday (see the green line)
Short: secondary, not really interested in short this market, unless a scalp third hour NY session HOD to LOD
Please note that the purpose of my analysis is to help me and you hunting the best trade setup for the day, none of my technical aspects are a way to forecast any directional market movement.
Gianni

Market Analysis: Crude Oil Price RisesMarket Analysis: Crude Oil Price Rises
Crude oil is recovering and might rise toward the $78.40 resistance zone.
Important Takeaways for Oil Prices Analysis Today
- Crude oil is recovering losses and trading above the $74.30 support.
- There was a break above a connecting bearish trend line with resistance near $73.50 on the hourly chart of XTI/USD at FXOpen.
Oil Price Technical Analysis
On the hourly chart of WTI Crude Oil at FXOpen, the price found support near the $72.40 zone against the US Dollar. The price formed a base and started a recovery wave above $73.50 and the 50-hour simple moving average.
The bulls were able to push the price toward the 50% Fib retracement level of the downward move from the $78.42 swing high to the $72.42 swing low. Besides, there was a break above a connecting bearish trend line with resistance near $73.50.
The hourly RSI is near the 65 level, but the price is struggling near $75.50. The next resistance is near the 61.8% Fib retracement level of the downward move from the $78.42 swing high to the $72.42 swing low at $76.15.
A clear move above the $76.15 could send the price toward the $77.50 resistance. Any more gains might send the price toward the $78.40 level. Conversely, the price might start a fresh decline from the $75.50 resistance.
Immediate support sits near the $74.30 level. The next major support on the WTI crude oil chart is $72.40. If there is a downside break, the price might decline toward $72.40. Any more losses may perhaps open the doors for a move toward the $71.20 support zone.
Start trading commodity CFDs with tight spreads. Open your trading account now or learn more about trading commodity CFDs with FXOpen.
This article represents the opinion of the Companies operating under the FXOpen brand only. It is not to be construed as an offer, solicitation, or recommendation with respect to products and services provided by the Companies operating under the FXOpen brand, nor is it to be considered financial advice.

USOIL - Heading Lower Looks like that little bounce was a short covering shakeout and now the dominant trend has resumed to the downside 🧐.
Not advice.

USOIL ALREADY REACHED TARGET Hey there on 4hTF the USOIL AFTER and before looking for
Target Achieved Successful done
So will see further downside from 76.50

Hellena | Oil (4H): Long, correction to the area of 76.326.Dear colleagues, I have analyzed for a long time and came to the conclusion that the price will probably continue to decline, but at the moment I see that wave “3” is not formed yet, and therefore wave “4” is not formed either. Therefore, I expect a correction to the area of 76.326, but it is desirable that the price does not reach the level of 76.50, because this is the minimum of wave “1”.
Manage your capital correctly and competently! Only enter trades based on reliable patterns!

USOIL ShortInstrument: USOIL
Position: Sell
Entry: 78.95
1st Target: 76.13
2nd Target: 75.50
Stop Loss: 79.70
Rationale:
USOIL is exhibiting signs of a bearish trend, supported by recent price action and fundamental factors.
Targets:
Our primary target stands at 76.13, representing a significant resistance level where we anticipate a price reaction. The secondary target is positioned at 75.50, indicating further potential downside momentum.
Stop Loss:
To manage risk effectively, a stop loss is placed at 79.70, just below the anticipated resistance level. This ensures a controlled exit in case of unexpected market movements.
Disclaimer:
Trading carries inherent risks, and this recommendation should be considered alongside individual risk tolerance and market analysis. It is advisable to employ proper risk management techniques, including the use of stop-loss orders, to mitigate potential losses.

USOILUSOIL is respecting its downtrend channel with a reason that OPEC+ (Organization of the Petroleum Exporting Countries and allies) is considering phasing out production cuts by the end of 2025. This increased supply could put downward pressure on prices, and also a potential global economic slowdown could dampen demand for oil, leading to lower prices, lets monitor.

USOIL - Start of a corrective rally??FX:USOIL looks to have created a short term low just below 7300.
Im now looking at a rally so watching this PB going into Monday for a potential move back up towards 78-80.
Watching for 7400-7480 on Monday to hold for the next move higher.
Enjoy the week. More updates coming.

USOIL PULLBACK BEFORE ANOTHER DIP#USOIL As predicted last time, we observed a significant drop following the breakout identified in the bullish channel. Currently, we see consolidation, a bearish impulse, and now a pullback. We anticipate another downward movement once the current bullish impulse concludes. This is expected to retest the recent lows near the major demand zone previously highlighted.

USOIL ( BREAKING TURNING LEVEL )USOIL
Tendency the price is a long in 76.23
Turning level : The turning 76.23, so as long as the price trending above this level, there will be a bullish trend
resistance level : trade above 76.23 , the price will up to 78.93, and stable this level up
to 80.80 and 82.88
support level : braking a turning level 76.23 , and stable this level ,the price will reach the support level of 74.57 and 72.27
corrective level : price will attempt 76.23 ,correct itself before long

USOILUSOIL - CRUDE OIL
Open: 73
SL: 71.82
TP: 76.70
==================
Disclaimer: Any content in this text does not constitute investment advice. This text provides an objective description of the market situation and should not be considered an offer to sell or a solicitation to buy.
Any decisions made based on the information provided in this text are your personal responsibility. Any investments made or to be made should be analyzed based on your financial situation and personal goals.
