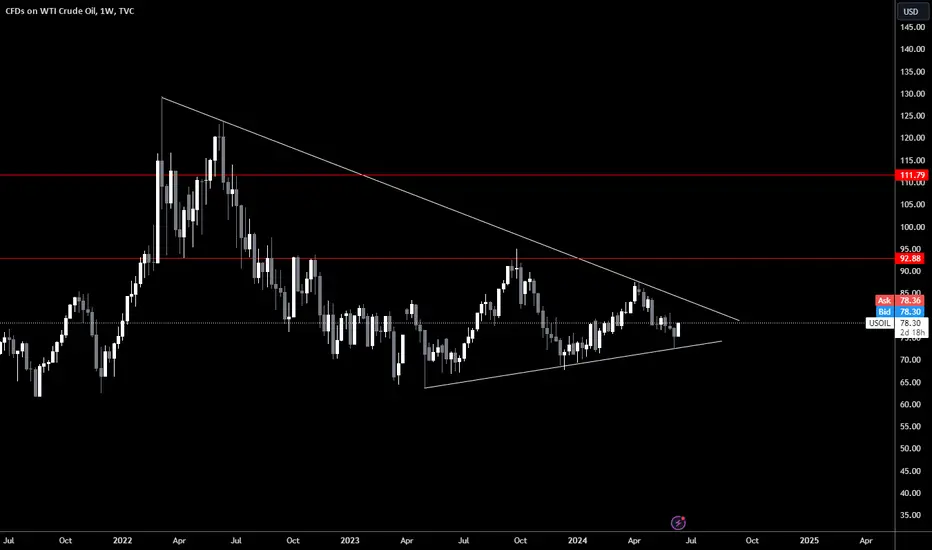
WTI bull runHello traders! I am currently looking at oil. I noticed a strong trend line that it bounced off from. we can see it heading to 92.00 and eventually 111.00 drop a like if you agree. follow for more ideas. thanks.
OILUSD trade ideas
Crude Oil (WTI) may fall to 77.25 - 77.70Pivot
78.45
Our preference
Short positions below 78.45 with targets at 77.70 & 77.25 in extension.
Alternative scenario
Above 78.45 look for further upside with 78.90 & 79.30 as targets.
Comment
As long as the resistance at 78.45 is not surpassed, the risk of the break below 77.70 remains high.
Supports and resistances
79.30
78.90
78.45
78.10 Last
77.70
77.25
76.60
Number of asterisks represents the strength of support and resistance levels

OIL LongExpecting price to form strong support at this area, continuing trending testing this weeks high.

Hellena | Oil (4H): Long, correction to the area of 76.326.Dear colleagues, I have analyzed for a long time and came to the conclusion that the price will probably continue to decline, but at the moment I see that wave “3” is not formed yet, and therefore wave “4” is not formed either. Therefore, I expect a correction to the area of 76.326, but it is desirable that the price does not reach the level of 76.50, because this is the minimum of wave “1”.
Manage your capital correctly and competently! Only enter trades based on reliable patterns!

Oil to move down impulsivelyBeen tracking this for sometime now, and it has mostly behaved as expected for a couple of months. The count in oil is hard to follow, because it does not necessarily "behave" within EWT parameters, but the pattern persists, despite irregularities. I will consider this validation or invalidation. I do not know the fundamentals that will cause such a move, but the waves have led me to this conclusion. Please, scroll back and review the count and magnitude and comment if you have a different count.


WTI ShortShort oil off 4hr resistance and breakout through 1hr counter trendline, head and shoulders with RSI divergence

Shock! This analysis will make you richThe market is trading below a bearish trendline which took place at the beginning of April ; the mid-term trend is then bearish for the black gold.
- However, since the impact over $72.43, the LCrude has registered a sharp bullish price action, led by bull traders who managed to defend that zone as well as short-sellers who bought their short positions back.
The market has registered a rare V-bottom chart pattern, typically indicating a bullish reversal to come.
This scenario seems to be confirmed by the RSI indicator which already registered a bullish break-out, above its 50% level.
Meanwhile, both moving averages are also in a positive configuration following a bullish cross, the first one since the start of the mid-term bearish trend.
- Even if a clear signal from the market, given by a sharp bullish break-out of the mid-term bearish trendline is yet to come, this is seen as a bullish configuration for the market.
Indeed, the fact bull traders have now taken control of the market while US oil stockpiles have recently significantly decreased makes the possibility of bullish trend resurgence likely on a mid-term basis.
If the market manages to clear the $78.00 level, a new bullish potential towards $79.75, $81.50 and $84.00 would be unlocked.

Monday/Tuesday Bullish.. Continuation on Wednesday? Hello Traders. The Monthly candle has flipped bullish and the weekly candle is pushing for new highs as the 3rd Asian session of the week kicks off here. Monday was super bullish and today's tuesday candle closed bullish after a late NY bullish push. We observed (4) 4hr candles print bearish consecutively only to be overshadowed by a large bullish candle that began it's ascent at around London close today. The Market is bullish and so continuing to look for longs up to the next 4hr level (79.00) is a scenario for the next session. Another scenario is we push to the 78.50 4hr level and then rollover towards (77.30) 4hr level. The market totally changed behavior after dipping into 73 Weekly Level. The last crude oil inventories, which was forecasted to see a decrease by 2.1m barrels, instead saw an increase and this lined up with a low in the market . The news was About 1.13$ off the low and has been a catalyst for this bullish momentum in the last few days. Interest rates, CPI and Inventories tomorrow will surely send the markets into an uproar so careful trading ahead.

USOILHi guys,
In this chart i Found a Supply Zone in USOIL CHART for short entry,
Observed these Levels based on price action and Demand & Supply.
*Don't Take any trades based on this Picture.
... because this chart is for educational purpose only not for Buy or Sell Recommendation..
Thank you

CRUDE OIL SHORT FROM FALLING RESISTANCE|
✅CRUDE OIL surged again to retest the falling resistance
But it is a strong line
So I think that there is a high chance
That we will see a bearish pullback and a move down
SHORT🔥
✅Like and subscribe to never miss a new idea!✅

OIL demand in controlRetail traders have been faked by a gap in oil prices, exactly into a daily demand zone, which the big players may use to take price higher

OIL MAP FY24-25 : GUNS BLAZING, RIGS BLOWING, OCEAN BURNINGthis post is meant to be a refresher for the dedicated analysts
Can you imagine the ocean on fire like in that one Simpsons episode
Honestly this is just for the conspiracy gang (are we still saying gang?)
Anyways biden manipulated my last forecast but he cant fight supply and demand 4ever
unless he backed by some super market maker power that wants a certain war to take place as they expand their nations territory while ruining relations with the world...
Assuring him if oil prices are affected we will roll in a trillion and supply based propaganda to short it no biggie that is what i suspect if im wrong again
that said as each zone breaks im expecting headlines of the sorts
i heard people like to stalk the barrels notica how they are showing dark lining inside the circles showing they are no filled around plains all american
www.google.com

Could price reverse from here?USO/USD is rising towards a resistance level which is an overlap resistance that lines up with the 78.6% Fibonacci retracement and could potentially reverse from this level to our take profit.
Entry: 78.92
Why we like it:
There is an overlap resistance level which lines up with the 78.6% Fibonacci retracement.
Stop loss: 80.80
Why we like it:
There is a pullback resistance level.
Take profit: 76.59
Why we like it:
There is an overlap support level which is slightly above the 38.2% Fibonacci retracement.
Please be advised that the information presented on TradingView is provided to Vantage (‘Vantage Global Limited’, ‘we’) by a third-party provider (‘Everest Fortune Group’). Please be reminded that you are solely responsible for the trading decisions on your account. There is a very high degree of risk involved in trading. Any information and/or content is intended entirely for research, educational and informational purposes only and does not constitute investment or consultation advice or investment strategy. The information is not tailored to the investment needs of any specific person and therefore does not involve a consideration of any of the investment objectives, financial situation or needs of any viewer that may receive it. Kindly also note that past performance is not a reliable indicator of future results. Actual results may differ materially from those anticipated in forward-looking or past performance statements. We assume no liability as to the accuracy or completeness of any of the information and/or content provided herein and the Company cannot be held responsible for any omission, mistake nor for any loss or damage including without limitation to any loss of profit which may arise from reliance on any information supplied by Everest Fortune Group.

OIL: Day 3 breakout traders long in the market, frontside Hi everyone and welcome to my channel, please don’t forget to support all my work subscribing and liking my post, and for any question leave me a comment, I will be more than happy to help you!
“Trade setups, not movements”
1. DAY OF THE WEEK (Failed Breakout, False Break, Range Expansion)
Monday DAY 1 Opening Range ✅ no daily cycle
Tuesday DAY 2 Initial Balance
Wednesday DAY 3 (reset DAY 1) Mid Point Week
Thursday DAY 2
Friday DAY 3 Closing Range
2. SIGNAL DAY
First Red Day
First Green Day
3 Days Long Breakout ✅
3 Days Short Breakout
Inside Day
3. WEEKLY TEMPLATE
Pump&Dump
Dump&Pump ✅
Frontside ✅
Backside
4. THESIS:
Long: primary, breakout traders short still in profit from monday NY session, the breakout as well left a gap which usually is the most common place to be filled. Potential weekly dump and pump template can be completed (not necessary by today). The market closed in balance on Friday, and no other time frames are triggered yet. I will be waiting for a daily level to be triggered, and if a buy low setup will present, I will take it without any hesitation!
Short: secondary, Wed to Fri I can see a potential "escalator up", which during the week it can lead to a short move going back into the low of week. However, the market opened inside the previous week, so let it to setup!
Please note that the purpose of my analysis is to help me and you hunting the best trade setup for the day, none of my technical aspects are a way to forecast any directional market movement.
Gianni

USOIL 2024/10/06 Analyzing the chart in the D1 timeframe, we see that price is in the last wave ABCDE triangle correction. In triangular corrections, the E wave is generally expected to be between. 0.50 and 0.618 of the length of the C wave
How can it be traded?
- The wave B correction can be followed and traded for wave C.
- Wave C can be followed and traded for the next big impulse.

USOIL Uptrend Line Breakout At $78.33 13.06.2024USOIL Uptrend Line Breakout: At $78.33
Bearish Scenario:
Target 1: $77.80
Target 2: $76.66 (if $77.80 breaks)
Bullish Scenario:
Target 1: $79.24
Target 2: $81.08 (if $79.24 breaks)
Apply Risk Management
Risk Warning: Trading in CFDs is highly speculative and carries a high level of risk. It is possible to lose all of your invested capital. These products may not be suitable for everyone, and you should ensure that you fully understand the risks taking into consideration your investment objectives, level of experience, personal circumstances as well as personal resources. Speculate only with funds that you can afford to lose. Seek independent advice if necessary. Please refer to our Risk Disclosure.
BDSwiss is a trading name of BDS Markets and BDS Ltd.
BDS Markets is a company incorporated under the laws of the Republic of Mauritius and is authorized and regulated by the Financial Services Commission of Mauritius ( FSC ) under license number C116016172, address: 6th Floor, Tower 1, Nexteracom Building 72201 Ebene.
BDS Ltd is authorized and regulated by the Financial Services Authority Seychelles (FSA) under license number SD047, address: Suite 3, Global Village, Jivan’s Complex, Mont Fleuri, Mahe, Seychelles. Payment transactions are managed by BDS Markets (Registration number: 143350)
Disclaimer

USOILCrude oil is a type of fossil fuel that is extracted from the earth and refined into various petroleum products, such as gasoline, diesel fuel, jet fuel, and heating oil. Here are some key facts about crude oil:

WTI off lows after earlier drop, but what now?Crude oil prices gave up their earlier gains, to turn modestly lower on the day after the release of the EIA weekly US oil inventories, before bouncing off their lows ahead of the FOMC rate decision. Watch the closing prices. A daily close in the red may lead to some follow-up selling in the days ahead, given that WTI has arrived and reacted negatively from the key $79 level.
Crude stocks came in at +3730K vs. -1025K expected and +1233K the week before. For gasoline, stocks came in at +2566K, significantly surpassing the expected +0.891K reading. Distillates, on the other hand, registered +881K against an anticipated +2147K. Refinery utilization saw a decrease of 0.4%, slightly more than the expected decline of 0.3%. Additionally, US crude imports reached their highest level since 2018, which may help explain the discrepancy in expectations.
Crude oil had staged a sharp recovery after hitting key support at $72.50 on Wednesday, before today’s struggles. The rally has been driven by hopes for increased fuel demand as the US driving season progresses. We have had a couple of stronger US macroeconomic pointers including the ISM services PMI and monthly jobs report that helped to reduce fears about demand weakness. Prices also found support from oversold conditions following a three-week decline that had been fuelled by concerns over Chinese demand and rising non-OPEC supply.
Today’s inventories figures were considered bearish by traders, and they sold oil after WTI had risen to test resistance and its bearish trend line around $79.
The lower highs suggest the short-term path of least resistance is still downward, until told otherwise by the charts.
In terms of support, the next important zone is between $76.00 and $76.50 for WTI, which had been both support and resistance in the past. If prices fall below this area, the bearish trend may resume, potentially triggering further technical selling.
Meanwhile the key resistance level to watch is around $79.00, give or take, where the trend line and the base of last week’s breakdown meet. This is where today’s rally has stalled for now. The bulls will need to see a close above here in order to initiate a move towards $80 and higher.
Written by Fawad Razaqzada, market analyst at FOREX.com
Follow me on twitter: x.com

Oil Spills into First Major SupportWTI has plunged more than 17.3% off the April highs with the decline responding to confluent support today at 72.14/93 - a region defined by the objective yearly open and the 2024 low-day close (LDC).
Looking for a reaction down here. . .
Initial resistance now eyed at 75.33 with bearish invalidation now lowered to 77.67 .
A break lower exposes the December LDC at 69.81 backed by the 2023 LDC at 68.527 .
Watch the weekly close here.
Michael Boutros, Sr Technical Strategist
@MBForex

USOil WTI Short 4Hour divergence- Trendline1. Market Analysis:
Asset: USOil (WTI Crude Oil)
Timeframe: 4-hour
Pattern: Bearish divergence identified
Additional Confirmation: Trendline resistance
2. Entry Criteria:
Divergence Confirmation: Identify bearish divergence on the 4-hour timeframe using indicators like RSI or MACD. Bearish divergence occurs when the price forms higher highs, but the indicator forms lower highs.
Trendline Resistance: Confirm that the price is approaching or touching a significant trendline resistance, which has been respected in the past.
3. Trade Setup:
Entry Point: Place a sell order near the trendline resistance once bearish divergence is confirmed and there is a rejection from the trendline. You can enter the trade at the close of a bearish candle that forms near the trendline resistance.
Stop-Loss: Set the stop-loss order above the recent swing high or slightly above the trendline to limit potential losses if the price breaks through the resistance.
Take-Profit: Determine your take-profit target based on key support levels or a favorable risk-reward ratio. Consider using a risk-reward ratio of at least 1:2 to ensure that potential profits outweigh potential losses.
4. Risk Management:
Position Size: Calculate your position size based on your risk tolerance and the distance between your entry point and stop-loss level. Ensure that you only risk a predetermined percentage of your trading capital per trade (e.g., 1-2%).
Risk-Reward Ratio: Aim for a risk-reward ratio of at least 1:2 or higher. This means if your stop-loss is 50 pips above your entry, your take-profit should be at least 100 pips below your entry.
5. Additional Confirmation:
Volume Analysis: Check for an increase in volume to confirm the validity of the bearish divergence and the potential for a strong downward move.
Support and Resistance: Ensure that the trade aligns with key support and resistance levels on higher timeframes (e.g., daily or weekly).
6. Trade Execution:
Place Orders: Set your sell order, stop-loss, and take-profit levels according to the above criteria.
Monitor the Trade: Keep an eye on the trade to manage it effectively. Adjust the stop-loss to break even or trail it as the trade progresses in your favor if necessary.
7. Review and Adjust:
Post-Trade Analysis: After the trade is closed, review the outcome to learn from the trade. Evaluate what worked well and what could be improved for future trades.
Example Trade Setup on TradingView:

USOIL ShortInstrument: USOIL
Position: Sell
Entry: 78.95
1st Target: 76.13
2nd Target: 75.50
Stop Loss: 79.70
Rationale:
USOIL is exhibiting signs of a bearish trend, supported by recent price action and fundamental factors.
Targets:
Our primary target stands at 76.13, representing a significant resistance level where we anticipate a price reaction. The secondary target is positioned at 75.50, indicating further potential downside momentum.
Stop Loss:
To manage risk effectively, a stop loss is placed at 79.70, just below the anticipated resistance level. This ensures a controlled exit in case of unexpected market movements.
Disclaimer:
Trading carries inherent risks, and this recommendation should be considered alongside individual risk tolerance and market analysis. It is advisable to employ proper risk management techniques, including the use of stop-loss orders, to mitigate potential losses.

USOIL ( BREAKING TURNING LEVEL )USOIL
Tendency the price is a long in 76.23
Turning level : The turning 76.23, so as long as the price trending above this level, there will be a bullish trend
resistance level : trade above 76.23 , the price will up to 78.93, and stable this level up
to 80.80 and 82.88
support level : braking a turning level 76.23 , and stable this level ,the price will reach the support level of 74.57 and 72.27
corrective level : price will attempt 76.23 ,correct itself before long
