OILUSD trade ideas

USOIL BEARS WILL DOMINATE THE MARKET|SHORT
Hello,Friends!
We are targeting the 77.96 level area with our short trade on USOIL which is based on the fact that the pair is overbought on the BB band scale and is also approaching a resistance line above thus going us a good entry option.
✅LIKE AND COMMENT MY IDEAS✅

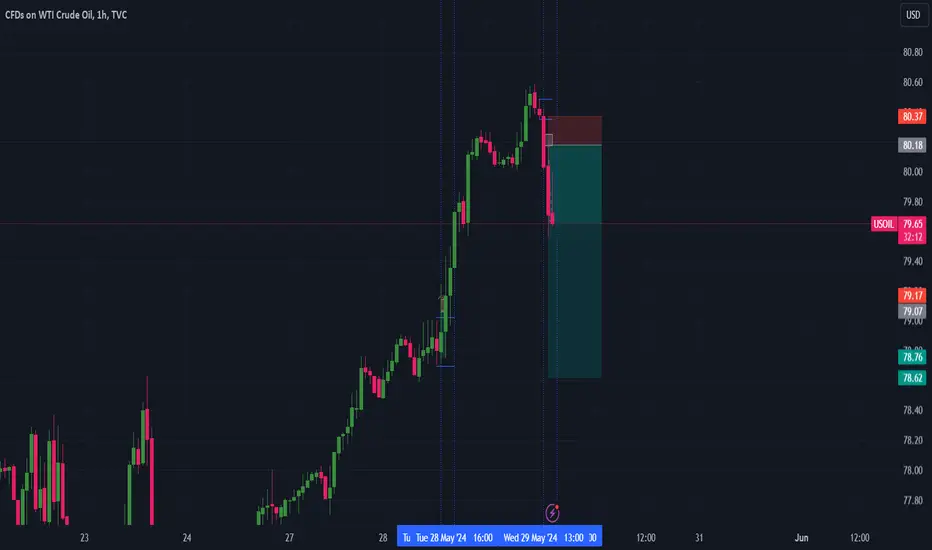
USOIL SLIP DOWNSIDE Hey there on 1hTF the USOIL has looks for here downside
After reach 80 and quickly drop now will expect can be reach
77

USOIL: Current oil prices are widening their fluctuation rangeUSOIL: Current oil costs are widening their fluctuation range. The short-time period upward fashion because of climate facts in North America and Texas reasons short-time period worries approximately oil output on this region. However, withinside the future, oil costs will nevertheless generally tend to lower and watch for bulletins from OPEC+. We can see that individuals of OPEC+ and Russia have all proven symptoms and symptoms of growing production, so the chance of a lower in oil costs is surprisingly high. Consider promoting across the modern rate range. Target is 76$/1 barrel

oil 30mOn the upside, the 55-day Simple Moving Average (SMA) at $81.31 and the descending trendline at $81.85 are forming an area with a lot of resistance.

Crude oil continues to run in the 77~80 rangeCrude oil continues to run in the 77~80 range, waiting for a breakthrough, continue to sell high and buy low
Crude oil technical analysis
Daily resistance 79-80, lower support 76.8
Four-hour resistance is 79-80, and support below is 77-76.8
Crude oil operation advice: Crude oil was under pressure at the 79.2 mark yesterday and ushered in a weak and volatile downward breakthrough. The Asian and European prices fluctuated sideways and came under pressure near the 79 mark, then fell back and fell rapidly, falling back to a weak rebound near 78.2. NY time was under pressure at the 79 mark and ushered in an accelerated decline. Finally, the price fell to around 77.6 and stabilized.
The overall price appears to be suppressed at the 79 mark. Short-term oil prices continue to show a daily red-green cycle rhythm. Today, the lower support focuses on 77.2-77, and the upper pressure focuses on 79.5-80. The day will continue to rely on this range to maintain a wide range of long and short shocks. The watershed between short-term long and short strength still focuses on the 80 integer mark. Before the daily level reaches 80, it will continue to maintain long and short shocks between 77 and 80.
BUY:77.0 near SL:76.70
BUY:76.8 near SL:76.40
BUY:79.6 near SL:79.30
Technical analysis only provides trading direction!

WTI New Trend BeginningWe can see on the 4H that the downtrend has been broken, waiting for a confirmed retest of the old trendline before entering. We could see consolidation for a little while however. Swing trade.

Short Crude OilOn Daily Chart and 4H chart we created the megaphone(broadening formation) so I would check the top boarder of the formation and look for breaking market structure.

Crude Oil: Long Position Amidst Support and SeasonalityWe are considering a long position on crude oil, given that the price has reached a significant support area. This support level is reinforced by a divergence observed on the Relative Strength Index (RSI), suggesting a potential reversal in the current trend. Additionally, seasonality data supports the likelihood of a bullish movement during this period.
The convergence of these technical indicators and historical trends strengthens our conviction for a long setup. The RSI divergence indicates that the recent downward momentum may be waning, while the support area provides a strong foundation for a potential price rebound. Furthermore, seasonality data, which highlights recurring patterns in price behavior during specific times of the year, suggests that crude oil prices are poised for an upward movement.
In light of these factors, we are looking to establish a long position on crude oil, capitalizing on the technical setup and historical data that align to suggest a favorable entry point for a bullish trade.

usoil analysisusoil broke out the downtrend, and started a correction after the breakout, i expect that usoil is retesting the support zone on golden zone fibbo, before going bullish.

USOIL - NEW BREAKOUT !
After a huge bearish move (double top pattern)
The USOIL reached the support level (77.98 - 76.82) and failed to break it!
The price formed a rectangle pattern.
Currently, The resistance level and line are broken.
So, I expect a bullish move📈
----------------
TARGET: 83.20🎯

US-OIL - LONG Technical Trade
Summary
Entry = 79.406
Target 1= 82.283
Target 2 = 85.000
Risk : Reward= 2.33
Follow and Boost and my ideas!!!
Let's grow together.

CRUDE OIL (WTI): Is That a Bull Trap?!
Crude Oil may drop after a potential bullish trap:
we see a bullish inducement and a violation of a key horizontal resistance,
followed by a strong bearish imbalance.
I think that the market may drop at least to 78.8 level.
❤️Please, support my work with like, thank you!❤️

OIL: First green dayHi everyone and welcome to my channel, please don’t forget to support all my work subscribing and liking my post, and for any question leave me a comment, I will be more than happy to help you!
“Trade setups, not movements”
1. DAY OF THE WEEK (Failed Breakout, False Break, Range Expansion)
Monday DAY 1 Opening Range ✅ day 2 cycle
Tuesday DAY 2 Initial Balance
Wednesday DAY 3 (reset DAY 1) Mid Point Week
Thursday DAY 2
Friday DAY 3 Closing Range
2. SIGNAL DAY
First Red Day
First Green Day ✅
3 Days Long Breakout
3 Days Short Breakout
Inside Day
3. WEEKLY TEMPLATE
Pump&Dump
Dump&Pump ✅
Frontside ✅
Backside
4. THESIS:
Long: This market could coiling for an explosive move back to the previous HOW, where short traders are still in profit
Short: I do not exclude the secondary scenario of pump and dump starting from Friday, eventually evolving during the further days
Please note that the purpose of my analysis is to help me and you hunting the best trade setup for the day, none of my technical aspects are a way to forecast any directional market movement.
Gianni

USOILUSOIL is in bullish trend.
Bearish divergence also form in RSI which shows that this might be the last HH.
We wait and watch for the breakout of last HL.

Clean up on Isle 6All ideas are strictly my interpretation of price action. I am not a professional trader nor is this
professional advice.

WTI $USOIL BullishGIven the support from the asian session this morning, WTI already broke the 200EMA yesterday. Europe is going to take it further. 80.12 -> 83.0

Crude Oil (WTI) may rise to 80.90 - 81.35Pivot
79.35
Our preference
Long positions above 79.35 with targets at 80.90 & 81.35 in extension.
Alternative scenario
Below 79.35 look for further downside with 78.95 & 78.50 as targets.
Comment
The RSI advocates for further upside.
Supports and resistances
81.90
81.35
80.90
80.23 Last
79.35
78.95
78.50
Number of asterisks represents the strength of support and resistance levels.

OIL will going up around 83Oil will going up aroung 83, Buy now.
we can see Oil has Descending Braodening Wedge Pattern.


US OILWe are starting to see the early signs of seasonal tendencies across all markets. Price took out the 76.84 low (Turtle soup) on which it is acting as a support currently. The consolidation we are currently in will most likely be broken in the next week and we will look for an entry long on the lower TF as well. Target 1 coming in at 82.05, Target 2 at 84.42 and Target 3 at 87.59 More updates to follow

WTI Oil H4 | Falling to pullback supportWTI oil (USOIL) is falling towards a pullback support and could potentially bounce off this level to climb higher.
Buy entry is at 79.94 which is a pullback support.
Stop loss is at 79.00 which is a level that lies underneath the 23.6% Fibonacci retracement level.
Take profit is at 82.41 which is a pullback resistance.
High Risk Investment Warning
Trading Forex/CFDs on margin carries a high level of risk and may not be suitable for all investors. Leverage can work against you.
Stratos Markets Limited (www.fxcm.com):
CFDs are complex instruments and come with a high risk of losing money rapidly due to leverage. 68% of retail investor accounts lose money when trading CFDs with this provider. You should consider whether you understand how CFDs work and whether you can afford to take the high risk of losing your money.
Stratos Europe Ltd, previously FXCM EU Ltd (www.fxcm.com):
CFDs are complex instruments and come with a high risk of losing money rapidly due to leverage. 70% of retail investor accounts lose money when trading CFDs with this provider. You should consider whether you understand how CFDs work and whether you can afford to take the high risk of losing your money.
Stratos Trading Pty. Limited (www.fxcm.com):
Trading FX/CFDs carries significant risks. FXCM AU (AFSL 309763), please read the Financial Services Guide, Product Disclosure Statement, Target Market Determination and Terms of Business at www.fxcm.com
Stratos Global LLC (www.fxcm.com):
Losses can exceed deposits.
Please be advised that the information presented on TradingView is provided to FXCM (‘Company’, ‘we’) by a third-party provider (‘TFA Global Pte Ltd’). Please be reminded that you are solely responsible for the trading decisions on your account. There is a very high degree of risk involved in trading. Any information and/or content is intended entirely for research, educational and informational purposes only and does not constitute investment or consultation advice or investment strategy. The information is not tailored to the investment needs of any specific person and therefore does not involve a consideration of any of the investment objectives, financial situation or needs of any viewer that may receive it. Kindly also note that past performance is not a reliable indicator of future results. Actual results may differ materially from those anticipated in forward-looking or past performance statements. We assume no liability as to the accuracy or completeness of any of the information and/or content provided herein and the Company cannot be held responsible for any omission, mistake nor for any loss or damage including without limitation to any loss of profit which may arise from reliance on any information supplied by TFA Global Pte Ltd.
The speaker(s) is neither an employee, agent nor representative of FXCM and is therefore acting independently. The opinions given are their own, constitute general market commentary, and do not constitute the opinion or advice of FXCM or any form of personal or investment advice. FXCM neither endorses nor guarantees offerings of third-party speakers, nor is FXCM responsible for the content, veracity or opinions of third-party speakers, presenters or participants.
