USOILRSI indicates Bullish Divergence. Which means that at any time the market trend can change to HH and HL.
OIL_CRUDE trade ideas

Crude oil-further to fall?Crude finally found some support yesterday, bringing to an end a five-session run of back-to-back losses. Just over a week ago, front-month WTI was closing in on $80.50, trading at its highest level since the beginning of May, and appearing to break out of a month-long trading range. But it then reversed sharply, and went on to fall 10% over the following week. Yesterday it managed to rally a touch. The question now is whether oil can rally back significantly from here, or if this simply represents a pause in a sell-off which has further to go. Front-month WTI is still trading well above the low hit in mid-December low of $68. Is that the target for short-sellers, or will they be happy to take profits at current levels? While the daily MACD indicates that the market is oversold, and therefore a bounce is possible, recent history suggests that prices can become even more oversold than they are now. It could be that the market requires even more of a downside flush before it finds firm support from which a robust rally can begin.

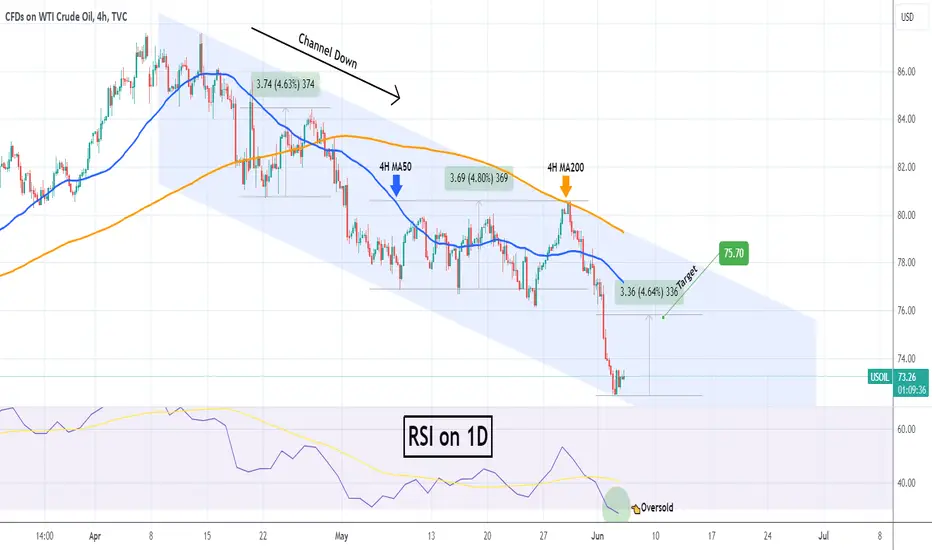
WTI OIL Oversold. Short-term buy signal.WTI Oil (USOIL) hit the bottom of the 2-month Channel Down and is consolidating since yesterday. This prompts to being a technical Lower Low for the pattern and the buy signal gets even stronger as the 1D RSI broke below the oversold barrier for the first time in 6 months (since December 06 2023).
The 4H MA200 (orange trend-line) provided the last rejection (Lower High) on May 29, so that is our Resistance and unless we break above it, the long-term trend remains bearish. But on the short-term we will use this oversold opportunity to buy and target 75.70 (+4.65% rise, which has been the minimum Bullish Leg % within the Channel Down.
-------------------------------------------------------------------------------
** Please LIKE 👍, FOLLOW ✅, SHARE 🙌 and COMMENT ✍ if you enjoy this idea! Also share your ideas and charts in the comments section below! This is best way to keep it relevant, support us, keep the content here free and allow the idea to reach as many people as possible. **
-------------------------------------------------------------------------------
💸💸💸💸💸💸
👇 👇 👇 👇 👇 👇
Oil plummets amid rising inventories and OPEC+ decision spookingUS crude price is trying to reverse some of the losses on Wednesday morning after five days of continued selloff. West Texas Intermediate (WTI) dipped to a four-month low on Tuesday, finally finding some support at 72.6. Momentum had already been struggling when OPEC+ announced at the weekend it would start to gradually increase production later this year. Markets were sceptical about the decision given the market has already shown signs of weakness in demand. WTI dropped over 3.5% on Monday.
But more fuel was added to the bearish fire on Tuesday when inventory data showed a large buildup. The American Petroleum Institute (API) revealed that crude oil inventories in the United States rose by 4.052 million barrels for the week ending May 24. Markets were expecting a drop of 1.9 million barrels.
The reaction to the OPEC+ announcement may have been a little overextended. The decision comes at a time when traders are already nervous about the fact that interest rates remain so high still, and how that will affect economic growth in the future. A series of weak data readings in China have led to concerns about future demand, alongside how major economies in Europe and the US will fare in the future. The fact that markets have reacted this way may draw attention to the soundness of the global economy, and whether central banks have gone too far with their policy tightness.
The focus will be drawn to the ECB meeting this week and the Federal Reserve meeting next week to determine how much further markets will need to endure high interest rates. Markets remain highly confident that the ECB will cut rates by 25bps on Thursday. The US jobs data released on Friday will also be important for oil traders as it will affect the overall risk appetite and sentiment in global markets.
On the chart, WTI has become oversold in the short term, with the RSI bouncing off the 30 line as it attempts to find support to reverse higher. The bias remains bearish, but we may see some dip buying around current levels resetting some of the selloff. The fact that the price has dropped below the descending trend line support and remains below all four of its key moving averages suggests buyers are going to find continued resistance to move higher in the absence of a bullish catalyst.

USOILCrude oil is a type of fossil fuel that is extracted from the earth and refined into various petroleum products, such as gasoline, diesel fuel, jet fuel, and heating oil. Here are some key facts about crude oil:

USOIL - Are we going up? Going to see how the day closes before taking any trade but here my thoughts
Technicals
→ Price respected .618 FIB retracement
→ We broke out of channel and retested it
→ Monthly candle will close semi-high probability we're going up to create at least a top monthly wick.
Fundamentals
→ Important next week is OPEC+ meeting 2nd June.
Trade
→ For intraday/swingers long opportunity to go up for about 1:3R
→ For scalpers good buy opportunities 20 pips at a time when price goes up.

OPEC Secretary-General Affirms Resilient Oil Demand
OPEC Secretary-General Affirms Resilient Oil Demand
OPEC Secretary-General Haitham Al-Ghais stated at the St. Petersburg International Economic Forum on Thursday that oil demand remains resilient. "It's crucial to stay focused on the fundamentals," he emphasized. "Economic growth, supply, and demand are what drive our decisions."
Al-Ghais noted that global demand increased by 2.3 million barrels per day in the first quarter, typically the weakest quarter due to global refinery maintenance. He anticipates continued strong demand in the coming months, particularly with the uptick in summer travel.
Saudi Energy Minister Dismisses Bearish Response to OPEC+ Deal, Confident Market Will Adjust
Saudi Energy Minister Prince Abdulaziz bin Salman dismissed the market's bearish reaction to OPEC+'s decision to gradually phase out voluntary output cuts, expressing confidence that the market will adjust. "Give it a day or two, reality will set in," he stated at the St. Petersburg International Economic Forum on Thursday. He criticized some banks and media outlets for their narratives around the meeting and reaffirmed that OPEC+ made the right decision. "I know that we did the best job," he asserted.
The OPEC+ meeting initially triggered an oil selloff, exacerbated by short selling and movements in the options market, as traders worried about potential oversupply. However, Abdulaziz emphasized that OPEC+ retains the flexibility to pause or reverse production increases based on market conditions.
OIL OUTLOOK
Oil prices increased early as we mentioned, recovering from a four-month low, which was the lowest point since February. This drop was attributed to an unexpected surge in U.S. stockpiles, indicating softer demand than anticipated.
Technically:
The price has stabilized within the bearish zone, having already corrected the previous barrier which is 75.39. This suggests a continuation of the bearish trend, with potential targets at 72.500 and 70.570. A further break below 72.500 could lead the price down to 70.570.
Conversely, if the price stabilizes above 75.400, it may indicate a bullish trend, potentially reaching up to 78.070.
Pivot line: 75.390
Support lines: 72.50, 70.57, 68.12
Resistance lines: 76.80, 78.07, 79.35
The movement range will be between support 70.57 and Resistance 76.80
previous idea:

WTI CRUDE OIL: Opportunities to profit sideways.WTI Crude Oil turned bearish on its 1D technical outlook (RSI = 39.681, MACD = -1.020, ADX = 30.568) but remains neutral on 1W (RSI = 46.231) as it is approaching again the 1W MA200. That is a critical Support as not only it is untouched since February 5th but is the long term level that Oil has been bouncing aggressively on since March 2023. We look towards a Rectangle consolidation-accumulation as the last two times that the 1W MA200 was tested. We will buy on S1 and target the R1 level (TP = 80.60). Until we close over the 1D MA50, our strategy is to scalp this range.
## If you like our free content follow our profile to get more daily ideas. ##
## Comments and likes are greatly appreciated. ##

OIL demand in controlRetail traders have been faked by a gap in oil prices, exactly into a daily demand zone, which the big players may use to take price higher

Oil Spills into First Major SupportWTI has plunged more than 17.3% off the April highs with the decline responding to confluent support today at 72.14/93 - a region defined by the objective yearly open and the 2024 low-day close (LDC).
Looking for a reaction down here. . .
Initial resistance now eyed at 75.33 with bearish invalidation now lowered to 77.67 .
A break lower exposes the December LDC at 69.81 backed by the 2023 LDC at 68.527 .
Watch the weekly close here.
Michael Boutros, Sr Technical Strategist
@MBForex

USOILUSOIL - CRUDE OIL
Open: 73
SL: 71.82
TP: 76.70
==================
Disclaimer: Any content in this text does not constitute investment advice. This text provides an objective description of the market situation and should not be considered an offer to sell or a solicitation to buy.
Any decisions made based on the information provided in this text are your personal responsibility. Any investments made or to be made should be analyzed based on your financial situation and personal goals.

USOIL - TOWARD 75.40Oil prices increased early as we mentioned, recovering from a six-week low after a significant 4.3% fall the previous day, which was the lowest point since mid-March. This drop was attributed to an unexpected surge in U.S. stockpiles, indicating softer demand than anticipated.
At the same time, market observers have pointed out that the Federal Reserve has kept interest rates steady, diminishing earlier expectations for a rate cut. PVM Oil Associates commented, "The reduction in borrowing costs may not occur as soon or as quickly as previously thought. It is similar to peak oil demand—consistently anticipated yet never realized."
Technically:
The price has stabilized within the bearish zone, having already breached the pivotal range between 80.73 and 82.24. This suggests a continuation of the bearish trend, with potential targets at 76.80 and 75.35. A further break below 75.35 could lead the price down to 69.78.
Conversely, if the price stabilizes above 82.24, it may indicate a bullish trend, potentially reaching up to 86.86.
Pivot line: 78.00
Support lines: 76.80, 75.35, 69.78
Resistance lines: 80.73, 82.24, 86.86

CRUDE OIL BEARISH SETUP|SHORT|
✅CRUDE OIL surged again to retest the resistance of 76.77$
But it is a strong key level
So I think that there is a high chance
That we will see a bearish pullback and a move down
SHORT🔥
✅Like and subscribe to never miss a new idea!✅

3105 USOIL could reach 73 in the near coming ?Hello traders,
USOIL is making a smiling curve on weekly chart, check the left one. This means in a long term view, OIL will rise again.
But right now on 6H right chart, in the middle term view, it could reach 73 first to finish a five-wave downtrend to reach the support level or buying zone.
The triangle with the mouth open is an oscillating pattern. When the price touches the suppression line above the triangle, it is time to go short. Fibo ext 1.618 is where it will possible reach as the end of 5th wave.
GOOD LUCK!
LESS IS MORE!

WTI in daily chart Hello
I don't think it is necessary to repeat same expressions because it is really boring. What is happening in OIL market is to decrease the price and increase the sell power to balance it.
WTI was able to penetrate into our resistance level and it is making a first wave. We traders should change our decisions whenever it is necessary and never insist in our ideas. For now I am following the bearish market for Oil. I am not sure how long it can correct (may till Trump becomes US president) and we have to decide fir short-term because Oil (as I mentioned in my last ideas) is in a consolidation (range) are with many R/S level.
Thanks

OIL: Day 3 shorts traders in the market, still backsideHi everyone and welcome to my channel, please don’t forget to support all my work subscribing and liking my post, and for any question leave me a comment, I will be more than happy to help you!
“Trade setups, not movements”
1. DAY OF THE WEEK (Failed Breakout, False Break, Range Expansion)
Monday DAY 1 Opening Range
Tuesday DAY 2 Initial Balance ✅ No cycle
Wednesday DAY 3 (reset DAY 1) Mid Point Week
Thursday DAY 2
Friday DAY 3 Closing Range
2. SIGNAL DAY
First Red Day
First Green Day
3 Days Long Breakout
3 Days Short Breakout ✅
Inside Day
3. WEEKLY TEMPLATE
Pump&Dump ✅
Dump&Pump
Frontside
Backside ✅
4. THESIS:
Long: primary, today is Tuesday, day 2 of the week, low of the week as well, opening range in place and market kept breaking down. However, I would be interested in taking a reversal trade as a scalp, back into the breakout of yesterday low, scalp LOD(LOW) to Yesterday LOD)
Short: N/A I would not have any level to enter a potential down move, unless, and I repeat, unless before 10am the market will reach the previous LOD
Please note that the purpose of my analysis is to help me and you hunting the best trade setup for the day, none of my technical aspects are a way to forecast any directional market movement.
Gianni

WTI: Trend in 1H time framePlease pay special attention to the very accurate trend, and colored levels.
The chart is very sensitive and you should be very careful with your capital.
Be careful
BEST
MT

Hellena | Oil (4H): Long to resistance area of 84.42.Wave “4” traveled a greater distance than I had anticipated. At the moment I expect a small update of the 78.80 low and the beginning of the upward movement with the aim to reach the resistance area of 84.42.
Manage your capital correctly and competently! Only enter trades based on reliable patterns!

usoil is bearishInvestors are cautious about U.S. inflation and interest rates, pushing oil prices lower.
Fed officials indicate more signs of slowing inflation are needed for rate cuts.
Despite increased refinery capacity, demand remains weak, adding pressure on oil prices.
Given the persistent inflation concerns and the cautious stance of the Federal Reserve, the outlook for crude oil prices remains bearish in the short term. The combination of weak refinery demand, ample supply, and geopolitical uncertainties points to continued price pressure. However, OPEC+ production cuts could offer some support, preventing a steeper decline. Traders should monitor upcoming economic data and OPEC+ decisions closely for further market direction.

Fundamental & Technical analysis on USOILMay 20th 2024
Fundamental: Were seeing a up tick in Non-comm Long and Short positions being held. Shorts are increasing at a faster pace. The Net positions is positive and holding steady.
Commercial (Hedgers) short positions is increasing significantly quicker then Longs, Net position is negative and decreasing/holding.
Technical: I'm expecting to see consolidation for the coming week/s between 78-81 with price action making a lower high causing a fake EMA cross over to the upside and setting its self up for more down side.
Entry Criteria: For me to consider a entry i have to keep seeing Short positions increase for both Non-comm and Comm in the coming weeks as well as Non-comm Longs decreasing. Ideally for Price action i want to see USOIL consolidate then make a lower high before its leg down (BLUE), there's the possibility it makes the lower high without consolidating (RED) but I do need to see the 5 EMA cross down the 20 EMA while Momentum is negative and the Stochastic is crossing down 50%

US-Oil will further push upside After Testing TrendlineHello Traders
In This Chart XTIUSD HOURLY Forex Forecast By FOREX PLANET
today XTIUSD analysis 👆
🟢This Chart includes_ (XTIUSD market update)
🟢What is The Next Opportunity on XTIUSD Market
🟢how to Enter to the Valid Entry With Assurance Profit
This CHART is For Trader's that Want to Improve Their Technical Analysis Skills and Their Trading By Understanding How To Analyze The Market Using Multiple Timeframes and Understanding The Bigger Picture on the Charts

USOIL WTI: Bullish Momentum Ahead? - May 8, 2024Hey traders! 📈 Let's discuss the current outlook for USOIL WTI:
🔍 Technical Insight:
We've observed a compelling development in the WTI market as it recently touched the lowest point within the current uptrend channel, dipping below the golden pocket levels. This move prompts a closer examination of the prevailing market dynamics.
📊 Daily Timeframe Perspective:
Zooming out to the daily timeframe, the overarching trend remains bullish, reflecting the resilience of the oil market. However, it's crucial to note that a consolidation phase appears to be underway. Such periods of sideways movement often precede significant price actions.
🔄 Awaiting Breakout Momentum:
One notable aspect in recent days is the absence of substantial price movements, typically characterized by WTI's propensity for $3 or greater swings. This prolonged consolidation phase suggests that a significant move may be expected in the upcoming days.
💡 Anticipated Market Activity:
Given the historical tendencies of WTI, we anticipate a breakout from this consolidation phase in the near future. Such a move could potentially signal the resumption of bullish momentum or a reversal in the prevailing trend.
📈 Trading Strategy Consideration:
For traders, exercising patience while monitoring price action for signs of breakout momentum is paramount. Deploying appropriate risk management strategies and remaining adaptable to evolving market conditions can help navigate uncertainty.
🔔 Key Takeaway:
As we await clarity on WTI's next directional move, it's essential to stay vigilant and prepared to capitalize on emerging opportunities. Whether it's a continuation of the uptrend or a reversal, flexibility is key to navigating the dynamic oil market.
🛢️ Closing Thoughts:
In conclusion, while the current consolidation phase may signal a temporary lull in market activity, the potential for a significant move looms on the horizon. Keep a watchful eye on price developments and be ready to adjust your trading strategy accordingly.

USOIL - Short or Buy? Break down or retracement up?Technicals
1. We have been stuck in a range on a higher time frame for quite some time now.
2. On a higher time frame we failed to confirm a break-up from a trendline dating back to March 2022, which was the COVID-19 highs. A failed break-up of this mega trendline is normally a sign of big reversal or retracement. & we did just that ;-) question is, is this a reversal or just a retracement because I see also a trendline from DEC 2023 which we trade just under. IMO we have not fully confirmed that break down.
3. Visible in my chart we see that we are since then on a big down sloping channel which is still respected.
Fundamentals
1. My bias is slightly bearish long term because I think the US economy & other major economies will be in a recession which will give downside pressure on the price of OIL
2. Conflict in the Middle East seems to have not a significant impact as of now on the price of USOIL. Will this change? Till I see major escalation happening I don't see that it will have greater impact than it already has. US also is less energy dependent so therefor geopolitical will impact less.
3. Bullish sign is that OPEC is still holding strong on OIL cuts and China is still strong. Summer season will also give some upside pressure because of demand.
Trade
1. The first trade, which is a buy option, I will take if I see buyers really taking over to push price up
2. The second trade, which is a sell, I will take if we confirm a break and retest of the weekly low.
Great trading all of you
Greetingz,
Simba Trades
