ONT ANALYSIS ONT has a bearish structure. We expect it to drop more.
The liquidity pools have been swept and now the price is looking for a powerful pivot.
The specified demand area is a good range for buy/long positions.
The targets are clear on the chart.
Closing a daily candle below the invalidation leve

#ONT/USDT is forming W pattern in 4-Hour TF!#ONT/USDT is forming W patteren in 4-Hour TF!
LSE:ONT needs to break the neckline$0.181 to turn bullish. Wait for BO/retest to long it. The local resistance level is PML $0.188 and the support level is PWL $0.1515.

ONTUSDT 1DConsider buying some #ONT in its support zone around $0.1576 and $0.1473. In case of a breakout, the short-term target is $0.2407. The other targets are:
$0.2836
$0.3183
$0.3529
$0.4023
$0.4652

**ONT/USDT TFW Key Support, Resistance LevelsBINANCE:ONTUSDT
This chart shows the price of Ontology (ONT) against Tether (USDT) on a weekly timeframe using Heikin Ashi candles. Here are some key points to note:
1. **Current Price**: The current price is 0.2129 USDT, down by 5.27%.
2. **Historical Price Movement**: The price has seen signi

#ONT/USDT breaks the Diagonal Trendline and fills the FVG in 4-H#ONT/USDT breaks the Diagonal Trendline and fills the FVG in 4-Hour TF!
LSE:ONT needs to clear the $0.218 to turn bullish. Wait for the breakout to open a long position. The next local resistance level is ASX:PWH $0.27.
#ONT/USDT is trying to break the Diagonal Trendline in 1-Hour TF#ONT/USDT is trying to break the Diagonal Trendline in 1-Hour TF!
LSE:ONT needs to clear the PDH $0.2675 to turn bullish. Wait for the breakout/retest to open a long position. The next local resistance level is NYSE:PML $0.286.

ONT - LONGFormed multiple harmonic patterns with strong order blocks and Wolfe wave.
Also, the harmonic targets meets the SK targets.

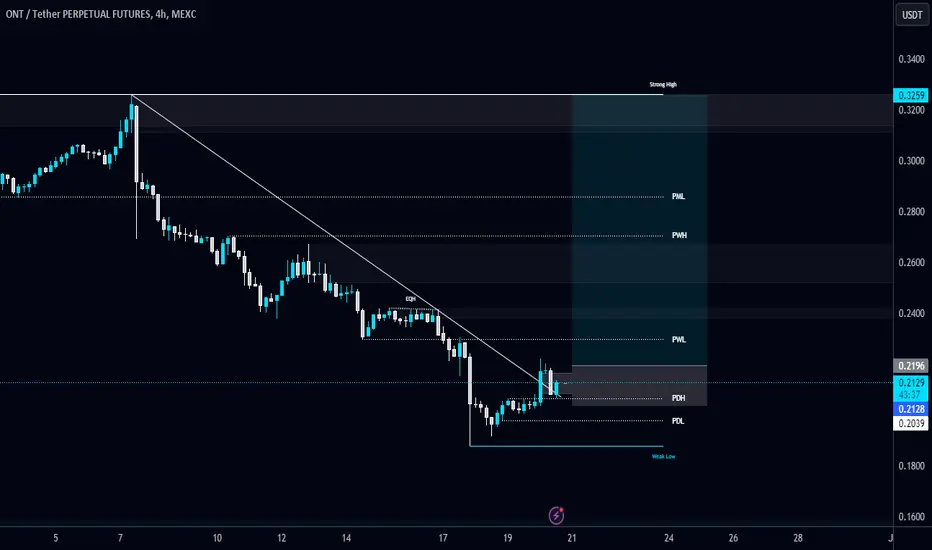
#ONT/USDT is trying to break the Diagonal Trendline in 4-Hour TF#ONT/USDT is trying to break the Diagonal Trendline in 4-Hour TF!
LSE:ONT needs to clear the trendline. Wait for the breakout to open a long position. The next local resistance level is $0.3245.

#ONT/USDT is holding PWL $0.3255 as a support level in 4-Hour TF#ONT/USDT is holding PWL $0.3255 as a support level in 4-Hour TF!
LSE:ONT needs to clear the Diagonal Trendline to turn bullish. Wait for the PDH $0.353 breakout to open a long position. The next local resistance level is ASX:PWH $0.419.

ONT Holders! FOLLOW ME~!Hey, Friends!
This is ESS team.
Let's check the ONTUSDT.
If it is supported by the GREEN uptrend line, We expect that candle breaks through the RED long-term downtrend line.
After the break, It will reach the PURPLE downtrend line, and if it is supported by the long-term downtrend line, It is e

See all ideas
Curated watchlists where ONTUSDT.P is featured.
