OP : THE GOLDEN BREAKOUT OF THE MOMENT✅OP seems to enter into a new breakout trend
The first signals show that this coin is able to have a breakout into the low time frame.
For this reason, it's interesting to follow and to see if this breakout will get confirmed coming time.
OPUSDT trade ideas

#OP, displaying strong volume activity.#OP
last few days have been displaying strong volume activity.
Key to flip this area as signal of continuation
UCTS 1D Buy printed a few days ago (~20% up so far)

OP capitulation candleOI divergence on today's drop. Possible reversal soon.
* the arrow on _OI was supposed to point down lol

OPUSDT analysis buying signal crypto Market in his way to our yellow buying zone (BC) after formation of impulsive (OA) wave with good correction (AB) wave RR:3:1

OP | A bearish divergence emerges.In the 4h time frame, OP has broken the past long-term bearish trend line ① and the recent important resistance line ②. The RSI is showing a bearish divergence. Trendline ③ may be broken. Return to the support of ②.
If you like and support our analysis, please give us a like and leave your comment. 😘
Good luck~☘

OP SCALP SHORTHello, dear traders. how are you ? Today we have a setup to SELL/SHORT the OP symbol.
For risk management, please don't forget stop loss and capital management
When we reach the first target, save some profit and then change the stop to entry
Comment if you have any questions
Thank You

OP/USDTOP/USDT
With a bullish divergence that is formed sideways on a very important support.
It can increase the price up to the ceiling of the channel and the area of 92 cents.
#OPUSDT #OP #BTCUSDT #BTC #ETHUSDT #DOGE #DOGEUSDT


OPtimism is ready to be on the parabolic The projected target, 886 has not been exactly reached. On the other hand, out of circumstancial evidences, I gather the rock bottom has been reached already
See the trendlines and charts

Op Clear Chart !!!op is broken previous support and turned it to Resistance also it's in a downtrend channel, i believe we are going to test 0.65 support and the best buy zone will be around 0.40- 0.44 , actually, its chart is so new and you should be careful in a chart like this, and as we know optimism gave airdrop to its user and most of them are selling even now,
-do not buy for long term
my opinion: maybe I buy in the final demand zone, but as I know never trust new charts like op, it has airdrop, and most people when getting free money will save.

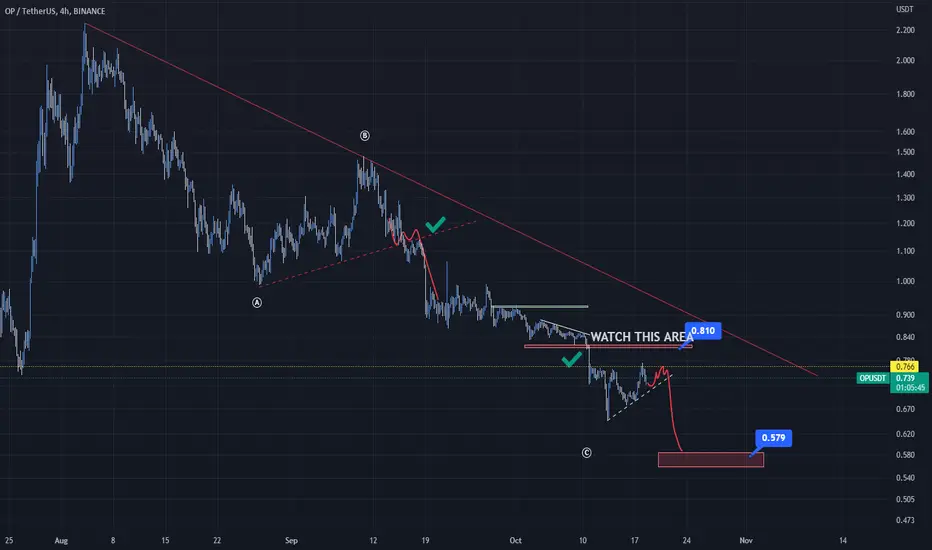
OP Final Short LEG with R/R 10In the last position from the OP/USDT, Our Entry was 0.8$ and we Take Profit of 0.7$ with a 10X Lev., We Got a +100% Profit, which was very Pleasant. :)
Now There Will be a Good Opportunity to get Another 10X Profit from this Cryptocurrency in another Short Position, Watch the Trend Line and wait for the Price to Break it Down.
This Scenario has a Precondition, That Price Should Not Pass 0.81$ Range, In This Case, The Price can Experience further Growth. So Watch The TREND LINE
So it is very likely that we will have a movement in the price similar to that shown by the red lines and eventually and we will enter a further downward movement to the $0.57 range after breaking the trend.
Take Care of Funds and Surf The Waves :)
Analysis of OP wavesHello, dear traders, I hope you are well.
By checking the wave structure, I think we are in the big C wave, which has become a diametric, and now we are in the D wave of this diametric. This is what I expect from the OP's chart.
Comment if you have any questions
Thank You


OP/USDTOP/USDT
It is located in a descending channel with a high slope.
I think it can grow to the ceiling of the channel after a little suffering.

Revised OptimismComparison original sketch vs revised. Same trend, new price, although low falls below liquidity.
Feel free to share your thoughts

Optimism OP price aims for x10 growthIt seems that the price of OPUSDT is completing the formation of the corrective wave 2 and the longest wave 3 of growth may be ahead of us.
Yesterday's trading day closed with a beautiful pin bar or hammer, which often serves as a signal for a trend reversal. Also, the shadow of the pin bar tested the strength of the liquidity zone $0.6-0.7, which previously acted as resistance and did not allow the OPUSD price to rise.
Such data allows you to try a medium-term trade on the following conditions:
Entry of the position at $0.71-0.73
Stop below $0.647 (-10.5%)
Take profit $1.534 (+112%)
Profit/loss ratio 11/1
Of course, you can fix take profit at each of the levels shown on the chart: $0.93 $1.15 $1.33
If we look at the Optimism token price chart globally, we can assume that the top of the 3rd wave of growth will be around $6.5-7.5, which is x10 growth from the current price
_____________________
Did you like our analysis? Leave a comment, like, and follow to get more
