Ashmore Group Stock Quote | Chart & Forecast SummaryKey Indicators On Trade Set Up In General
1. Push Set Up
2. Range Set up
3. Break & Retest Set Up
Notes On Session
# Ashmore Group Stock Quote
- Double Formation
* WXY Wave Count | Completed Survey
* (Reversal Argument)) At 2.200 GBP | Subdivision 1
- Triple Formation
* Not Numbered Retracement | S
Next report date
—
Report period
—
EPS estimate
—
Revenue estimate
—
0.17 USD
111.47 M USD
211.96 M USD
358.03 M
About Ashmore Group plc
Sector
Industry
CEO
Mark Langhorn Coombs
Website
Headquarters
London
Founded
1998
ISIN
GB00B132NW22
FIGI
BBG000TC4VY1
Ashmore Group Plc engages in the provision of investment management services. It provides core investment themes such as external debt, local currency, corporate debt, blended debt, equities, alternatives, overlay and liquidity, and multi-asset. It operates through the following geographical segment: The United Kingdom and Ireland, Americas, and Asia and Middle East. The company was founded in 1992 and is headquartered in London, the United Kingdom.
Related stocks

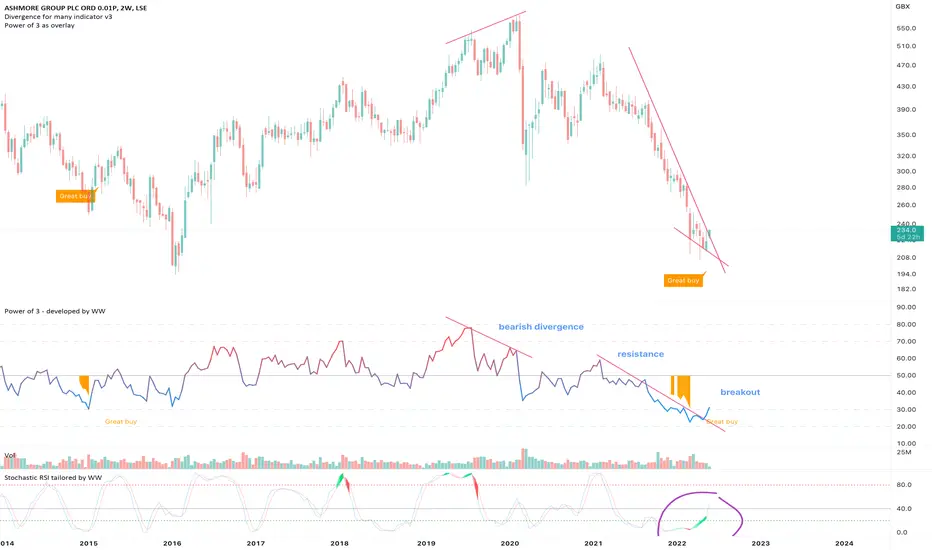
Ashmore Group PlcOn the above 2-week chart price action has corrected 60% since the bearish divergence back in February 2020. Now is an excellent time to be long, why?
1) A buy signal has printed.
2) Regular bullish divergence. 11 oscillators are currently printing bullish divergence with price action.
3) RSI and

See all ideas
Summarizing what the indicators are suggesting.
Neutral
SellBuy
Strong sellStrong buy
Strong sellSellNeutralBuyStrong buy
Neutral
SellBuy
Strong sellStrong buy
Strong sellSellNeutralBuyStrong buy
Neutral
SellBuy
Strong sellStrong buy
Strong sellSellNeutralBuyStrong buy
An aggregate view of professional's ratings.
Neutral
SellBuy
Strong sellStrong buy
Strong sellSellNeutralBuyStrong buy
Neutral
SellBuy
Strong sellStrong buy
Strong sellSellNeutralBuyStrong buy
Neutral
SellBuy
Strong sellStrong buy
Strong sellSellNeutralBuyStrong buy
Displays a symbol's price movements over previous years to identify recurring trends.
Frequently Asked Questions
The current price of AJMPF is 2.33 USD — it has decreased by −2.62% in the past 24 hours. Watch Ashmore Group Plc. stock price performance more closely on the chart.
Depending on the exchange, the stock ticker may vary. For instance, on OTC exchange Ashmore Group Plc. stocks are traded under the ticker AJMPF.
AJMPF stock has fallen by −9.79% compared to the previous week, the month change is a −1.17% fall, over the last year Ashmore Group Plc. has showed a −13.80% decrease.
We've gathered analysts' opinions on Ashmore Group Plc. future price: according to them, AJMPF price has a max estimate of 3.16 USD and a min estimate of 1.64 USD. Watch AJMPF chart and read a more detailed Ashmore Group Plc. stock forecast: see what analysts think of Ashmore Group Plc. and suggest that you do with its stocks.
AJMPF reached its all-time high on Mar 4, 2014 with the price of 9.57 USD, and its all-time low was 1.55 USD and was reached on Feb 25, 2009. View more price dynamics on AJMPF chart.
See other stocks reaching their highest and lowest prices.
See other stocks reaching their highest and lowest prices.
AJMPF stock is 13.49% volatile and has beta coefficient of 1.59. Track Ashmore Group Plc. stock price on the chart and check out the list of the most volatile stocks — is Ashmore Group Plc. there?
Today Ashmore Group Plc. has the market capitalization of 1.44 B, it has decreased by −11.19% over the last week.
Yes, you can track Ashmore Group Plc. financials in yearly and quarterly reports right on TradingView.
Ashmore Group Plc. is going to release the next earnings report on Feb 12, 2026. Keep track of upcoming events with our Earnings Calendar.
Ashmore Group Plc. revenue for the last half-year amounts to 96.63 M USD, despite the estimated figure of 96.63 M USD. In the next half-year revenue is expected to reach 98.66 M USD.
AJMPF net income for the last half-year is 60.54 M USD, while the previous report showed 46.42 M USD of net income which accounts for 30.43% change. Track more Ashmore Group Plc. financial stats to get the full picture.
Ashmore Group Plc. dividend yield was 10.80% in 2025, and payout ratio reached 138.87%. The year before the numbers were 9.94% and 121.32% correspondingly. See high-dividend stocks and find more opportunities for your portfolio.
As of Nov 17, 2025, the company has 272 employees. See our rating of the largest employees — is Ashmore Group Plc. on this list?
EBITDA measures a company's operating performance, its growth signifies an improvement in the efficiency of a company. Ashmore Group Plc. EBITDA is 100.49 M USD, and current EBITDA margin is 47.41%. See more stats in Ashmore Group Plc. financial statements.
Like other stocks, AJMPF shares are traded on stock exchanges, e.g. Nasdaq, Nyse, Euronext, and the easiest way to buy them is through an online stock broker. To do this, you need to open an account and follow a broker's procedures, then start trading. You can trade Ashmore Group Plc. stock right from TradingView charts — choose your broker and connect to your account.
Investing in stocks requires a comprehensive research: you should carefully study all the available data, e.g. company's financials, related news, and its technical analysis. So Ashmore Group Plc. technincal analysis shows the neutral today, and its 1 week rating is neutral. Since market conditions are prone to changes, it's worth looking a bit further into the future — according to the 1 month rating Ashmore Group Plc. stock shows the sell signal. See more of Ashmore Group Plc. technicals for a more comprehensive analysis.
If you're still not sure, try looking for inspiration in our curated watchlists.
If you're still not sure, try looking for inspiration in our curated watchlists.