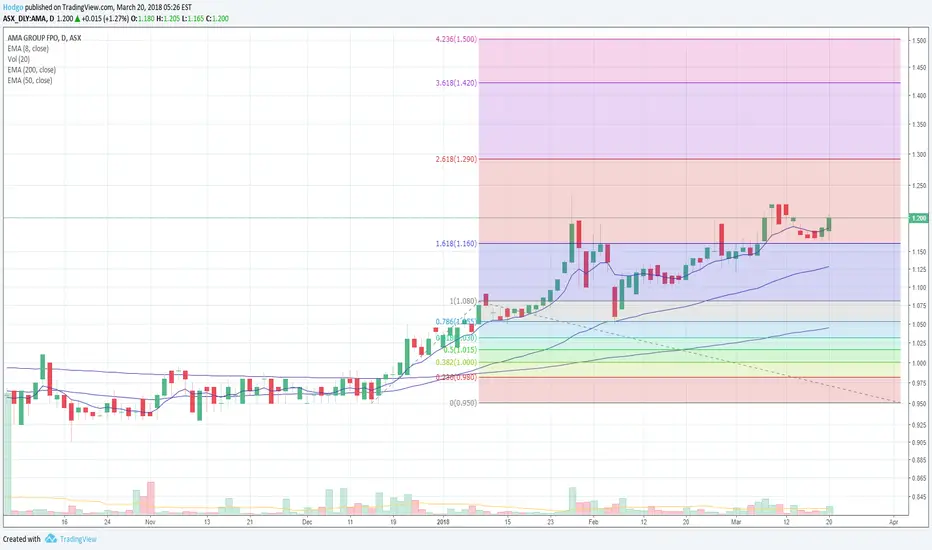
AMA - Trade PlanAMA is looking strong after breaking its downward sloping trendline and now backtesting it. I expect a thrust higher towards the previous highs and a continuation to the upside towards $0.645, its previous Resistane level for a potential 20% gain.
Please note these are my own notes, by no means tra
Next report date
—
Report period
—
EPS estimate
—
Revenue estimate
—
−0.0011 USD
−4.91 M USD
664.11 M USD
3.79 B
About AMA Group Limited
Sector
Industry
CEO
Raymond Smith-Roberts
Website
Headquarters
Melbourne
Founded
2005
ISIN
AU000000AMA8
FIGI
BBG00Z5JQC46
AMA Group Ltd. engages in the business of operating vehicle and heavy motor collision repair facilities and supplying automotive parts and consumables. It operates through the following segments: Vehicle Collision Repairs, Wales, and Corporate. The Vehicle Collision Repairs segment includes Capital S.M.A.R.T. and AMA Collision. The Heavy Motors segment provides dedicated and highly specialized facilities for all commercial vehicle repairs from light commercial to prime movers, b-doubles, buses, and earthmoving equipment. The Wales segment provides dedicated and highly specialized facilities for all commercial vehicle repairs, from light commercial to prime movers, B-doubles, buses, and earthmoving equipment. The company was founded on April 19, 2005 and is headquartered in Melbourne, Australia.
Related stocks

AMA to test support levels 40c and then 30c. AMA is a decent long-term stock that has just been sold down to long term support levels of low 40s. Director buying above this level, and should this fall through 40c, expect a test of 30c, which should be bottom of the barrell for this business that has decent fundamentals in the automotive space.

AMA - medium to long term buyBeen looking at AMA lately and have taken a position.
Chart
- Declining volume - nice and boring as it cools off and people forget about it, hopefully the market still in disbelief as it marches higher
- Gap fill on daily
- Magic line has turned up
Fundamentals
- Massive growth, 130 up to 180 rep

$AMA clear accumulation ahead of the next takeover offer.Fib levels are only a probility guide. If you are making the takeover offer, going much higher with your offer.
$AMA monthly close above $1.10 confirms breakout.Clear consolidation on the monthly charts. Provides great clarity.

See all ideas
Summarizing what the indicators are suggesting.
Neutral
SellBuy
Strong sellStrong buy
Strong sellSellNeutralBuyStrong buy
Neutral
SellBuy
Strong sellStrong buy
Strong sellSellNeutralBuyStrong buy
Neutral
SellBuy
Strong sellStrong buy
Strong sellSellNeutralBuyStrong buy
An aggregate view of professional's ratings.
Neutral
SellBuy
Strong sellStrong buy
Strong sellSellNeutralBuyStrong buy
Neutral
SellBuy
Strong sellStrong buy
Strong sellSellNeutralBuyStrong buy
Neutral
SellBuy
Strong sellStrong buy
Strong sellSellNeutralBuyStrong buy
Displays a symbol's price movements over previous years to identify recurring trends.
Frequently Asked Questions
The current price of AMGRF is 0.0400 USD — it has decreased by −11.11% in the past 24 hours. Watch AMA GROUP LTD. stock price performance more closely on the chart.
Depending on the exchange, the stock ticker may vary. For instance, on OTC exchange AMA GROUP LTD. stocks are traded under the ticker AMGRF.
We've gathered analysts' opinions on AMA GROUP LTD. future price: according to them, AMGRF price has a max estimate of 0.10 USD and a min estimate of 0.07 USD. Watch AMGRF chart and read a more detailed AMA GROUP LTD. stock forecast: see what analysts think of AMA GROUP LTD. and suggest that you do with its stocks.
AMGRF reached its all-time high on Mar 18, 2021 with the price of 0.4600 USD, and its all-time low was 0.0002 USD and was reached on Dec 7, 2023. View more price dynamics on AMGRF chart.
See other stocks reaching their highest and lowest prices.
See other stocks reaching their highest and lowest prices.
AMGRF stock is 12.50% volatile and has beta coefficient of 0.88. Track AMA GROUP LTD. stock price on the chart and check out the list of the most volatile stocks — is AMA GROUP LTD. there?
Today AMA GROUP LTD. has the market capitalization of 327.16 M, it has increased by 0.38% over the last week.
Yes, you can track AMA GROUP LTD. financials in yearly and quarterly reports right on TradingView.
AMA GROUP LTD. is going to release the next earnings report on Feb 24, 2026. Keep track of upcoming events with our Earnings Calendar.
AMGRF net income for the last half-year is −2.04 M USD, while the previous report showed −2.68 M USD of net income which accounts for 23.91% change. Track more AMA GROUP LTD. financial stats to get the full picture.
As of Sep 7, 2025, the company has 3.62 K employees. See our rating of the largest employees — is AMA GROUP LTD. on this list?
EBITDA measures a company's operating performance, its growth signifies an improvement in the efficiency of a company. AMA GROUP LTD. EBITDA is 71.67 M USD, and current EBITDA margin is 10.68%. See more stats in AMA GROUP LTD. financial statements.
Like other stocks, AMGRF shares are traded on stock exchanges, e.g. Nasdaq, Nyse, Euronext, and the easiest way to buy them is through an online stock broker. To do this, you need to open an account and follow a broker's procedures, then start trading. You can trade AMA GROUP LTD. stock right from TradingView charts — choose your broker and connect to your account.
Investing in stocks requires a comprehensive research: you should carefully study all the available data, e.g. company's financials, related news, and its technical analysis. So AMA GROUP LTD. technincal analysis shows the buy rating today, and its 1 week rating is buy. Since market conditions are prone to changes, it's worth looking a bit further into the future — according to the 1 month rating AMA GROUP LTD. stock shows the buy signal. See more of AMA GROUP LTD. technicals for a more comprehensive analysis.
If you're still not sure, try looking for inspiration in our curated watchlists.
If you're still not sure, try looking for inspiration in our curated watchlists.