Next report date
—
Report period
—
EPS estimate
—
Revenue estimate
—
0.03USD
15.33 MUSD
601.11 MUSD
346.29 M
About CHORUS LTD NPV
Sector
Industry
CEO
Mark Aue
Website
Headquarters
Wellington
Employees (FY)
846
Founded
2008
ISIN
NZCNUE0001S2
FIGI
BBG0145FZ2T7
Chorus Ltd. operates as a telecommunications infrastructure company. The firm engages in the provision of fixed line communications infrastructure services to retail service providers. It also offers nationwide network of fiber optic cables and copper cables that connect homes and businesses to each other and also provides backhaul and co-location services to retail service providers. The company was founded in March 2008 and is headquartered in Wellington, New Zealand.


CNU ideathis was a thought i had back on the 9/9/20 based on nothin just my stock finder stratergy its been almost 2 months and its changed just wanting to keep track of my ideas. so if my published ideas are rubbish that's fine its just my diary

Potential Buy Setup - CNUHere is one to watch, has broken out of a wide consolidation period, I will be interested in picking some up if it successfully retests the breakout level $7.40

$CNU - big volume Friday suggests the games up on this tricky. Break above $7.10 on volume. stop below 6.85.

$CNU - repeated large dumps at $6.95 makes the buy point clearLiking how this one is tightening up and volume coming in. Like to see more! and clear 6.95 with volume.


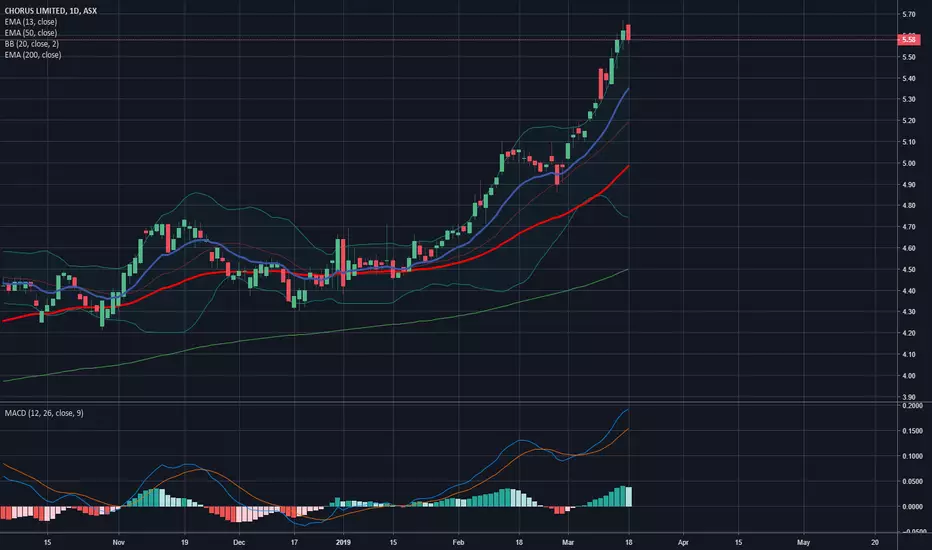
Bullish ? I think soAfter a retracement down to the 88.6% level, the price is breaking out strongly as RSI and indicators go green. A break and close above $5.25 will be potentially bullish

Short CNUDue to oversees market its still risk on, form a top down analysis for the communication sector is sitting on res as we speak with a bull shooting star follow by a bear hanging man. This is why i'm looking for a short to the downside with CNU, both daily and weekly are showing strength to the upside
CNU to benefit from sector strength-9 Week horizontal range
-Strong telecom sector with a lot of focus on the largest market share stock TLS, could help push this up
-Earnings on 27th so the later into the week the setup takes to follow through, the less likely I will be to enter
-Measured move to 4.22
Will wait for a daily low to s

See all ideas
Trade directly on the supercharts through our supported, fully-verified and user-reviewed brokers.


Frequently Asked Questions
The current price of CHRUF is 4.15 USD — it has decreased by 6.11% in the past 24 hours. Watch CHORUS LTD. stock price performance more closely on the chart.
Depending on the exchange, the stock ticker may vary. For instance, on OTC exchange CHORUS LTD. stocks are traded under the ticker CHRUF.
We've gathered analysts' opinions on CHORUS LTD. future price: according to them, CHRUF price has a max estimate of 4.99 USD and a min estimate of 3.39 USD. Watch CHRUF chart and read a more detailed CHORUS LTD. stock forecast: see what analysts think of CHORUS LTD. and suggest that you do with its stocks.
CHRUF reached its all-time high on Apr 14, 2023 with the price of 5.40 USD, and its all-time low was 3.93 USD and was reached on Oct 18, 2022. View more price dynamics on CHRUF chart.
See other stocks reaching their highest and lowest prices.
See other stocks reaching their highest and lowest prices.
CHRUF stock is 6.51% volatile and has beta coefficient of 0.88. Track CHORUS LTD. stock price on the chart and check out the list of the most volatile stocks — is CHORUS LTD. there?
Today CHORUS LTD. has the market capitalization of 1.94 B, it has decreased by 0.90% over the last week.
Yes, you can track CHORUS LTD. financials in yearly and quarterly reports right on TradingView.
CHORUS LTD. is going to release the next earnings report on Aug 19, 2024. Keep track of upcoming events with our Earnings Calendar.
CHORUS LTD. revenue for the last quarter amounts to 317.68 M USD despite the estimated figure of 316.11 M USD. In the next quarter revenue is expected to reach 312.34 M USD.
CHRUF net income for the last quarter is 3.16 M USD, while the quarter before that showed 9.81 M USD of net income which accounts for −67.82% change. Track more CHORUS LTD. financial stats to get the full picture.
CHORUS LTD. dividend yield was 5.04% in 2023, and payout ratio reached 753.55%. The year before the numbers were 5.19% and 262.22% correspondingly. See high-dividend stocks and find more opportunities for your portfolio.
As of May 28, 2024, the company has 846.00 employees. See our rating of the largest employees — is CHORUS LTD. on this list?
EBITDA measures a company's operating performance, its growth signifies an improvement in the efficiency of a company. CHORUS LTD. EBITDA is 427.58 M USD, and current EBITDA margin is 68.57%. See more stats in CHORUS LTD. financial statements.
Like other stocks, CHRUF shares are traded on stock exchanges, e.g. Nasdaq, Nyse, Euronext, and the easiest way to buy them is through an online stock broker. To do this, you need to open an account and follow a broker's procedures, then start trading. You can trade CHORUS LTD. stock right from TradingView charts — choose your broker and connect to your account.
Investing in stocks requires a comprehensive research: you should carefully study all the available data, e.g. company's financials, related news, and its technical analysis. So CHORUS LTD. technincal analysis shows the strong sell today, and its 1 week rating is strong sell. Since market conditions are prone to changes, it's worth looking a bit further into the future — according to the 1 month rating CHORUS LTD. stock shows the strong sell signal. See more of CHORUS LTD. technicals for a more comprehensive analysis.
If you're still not sure, try looking for inspiration in our curated watchlists.
If you're still not sure, try looking for inspiration in our curated watchlists.