NUF Longplease do your own analysis/research and make decisions based on own assessment.
i am not responsible for your decisions/outcomes.
Next report date
—
Report period
—
EPS estimate
—
Revenue estimate
—
−0.01USD
71.51 MUSD
2.24 BUSD
329.93 M
About NUFARM LIMITED
Sector
CEO
Gregory Allan Hunt
Headquarters
Melbourne
Website
Employees (FY)
3.08 K
Founded
2000
ISIN
AU000000NUF3
FIGI
BBG000BXYGY4
Nufarm Ltd. engages in the manufacture and sale of crop protection products. It operates through the Crop Protection and Seed Technologies segments. The Crop Protection segment deals with the manufacture and sale of crop protection products used by farmers to protect crops from damage caused by weeds, pests, and disease. The Seed Technologies segment sells seeds and treatment products. The company was founded by Maxwell A. Fremder on May 21, 1957 and is headquartered in Melbourne, Australia.

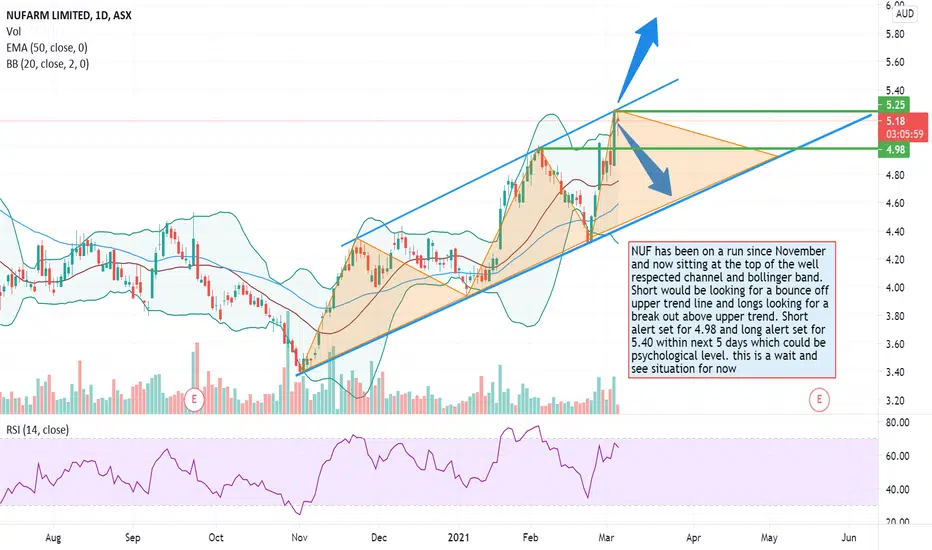
NUF has been on a run. What next?NUF has been on a run since November and now sitting at the top of the well respected channel and bollinger band. Short would be looking for a bounce off upper trend line and longs looking for a break out above upper trend. Short alert set for 4.98 and long alert set for 5.40 within next 5 days whic

NUF - TRADE PLANInverse head & shoulders
Divergence
Lower high, trend reversal
Bull channel
break and retest supply demand zone

Nufarm South America Asset SalesNufarm was up by more than 20% after confirming the sale of its South American assets, associated with seed treatment and crop protection. The company has sold the assets for A$1.19 billion to Sumitomo Chemical.
The transaction includes assets in Brazil, Chile, Colombia, and Argentina. The sale sho

NUF . A good time to BuyNUF’s stock is now floating at around -43% below its actual worth of $15.8, at the market price of AU$8.95, according to my discounted cash flow model. This difference in price and value gives us a chance to buy low.
NUF is also a financially robust company, as current assets can cover liabilities

See all ideas
Trade directly on the supercharts through our supported, fully-verified and user-reviewed brokers.


Frequently Asked Questions
The current price of NUFMF is 3.35 USD — it has decreased by 4.56% in the past 24 hours. Watch NuFarm Ltd. stock price performance more closely on the chart.
Depending on the exchange, the stock ticker may vary. For instance, on OTC exchange NuFarm Ltd. stocks are traded under the ticker NUFMF.
We've gathered analysts' opinions on NuFarm Ltd. future price: according to them, NUFMF price has a max estimate of 4.64 USD and a min estimate of 3.18 USD. Watch NUFMF chart and read a more detailed NuFarm Ltd. stock forecast: see what analysts think of NuFarm Ltd. and suggest that you do with its stocks.
NUFMF reached its all-time high on May 8, 2008 with the price of 17.25 USD, and its all-time low was 2.59 USD and was reached on Jun 10, 2019. View more price dynamics on NUFMF chart.
See other stocks reaching their highest and lowest prices.
See other stocks reaching their highest and lowest prices.
NUFMF stock is 4.78% volatile and has beta coefficient of 1.22. Track NuFarm Ltd. stock price on the chart and check out the list of the most volatile stocks — is NuFarm Ltd. there?
Today NuFarm Ltd. has the market capitalization of 1.16 B, it has decreased by 1.78% over the last week.
Yes, you can track NuFarm Ltd. financials in yearly and quarterly reports right on TradingView.
NuFarm Ltd. is going to release the next earnings report on Nov 14, 2024. Keep track of upcoming events with our Earnings Calendar.
NUFMF earnings for the last quarter are 0.07 USD per share, whereas the estimation was 0.11 USD resulting in a −35.61% surprise. The estimated earnings for the next quarter are −0.01 USD per share. See more details about NuFarm Ltd. earnings.
NuFarm Ltd. revenue for the last quarter amounts to 1.15 B USD despite the estimated figure of 1.35 B USD. In the next quarter revenue is expected to reach 1.13 B USD.
NUFMF net income for the last quarter is 32.06 M USD, while the quarter before that showed −24.39 M USD of net income which accounts for 231.47% change. Track more NuFarm Ltd. financial stats to get the full picture.
NuFarm Ltd. dividend yield was 2.11% in 2023, and payout ratio reached 38.08%. The year before the numbers were 2.00% and 38.01% correspondingly. See high-dividend stocks and find more opportunities for your portfolio.
As of May 27, 2024, the company has 3.08 K employees. See our rating of the largest employees — is NuFarm Ltd. on this list?
EBITDA measures a company's operating performance, its growth signifies an improvement in the efficiency of a company. NuFarm Ltd. EBITDA is 208.00 M USD, and current EBITDA margin is 12.48%. See more stats in NuFarm Ltd. financial statements.
Like other stocks, NUFMF shares are traded on stock exchanges, e.g. Nasdaq, Nyse, Euronext, and the easiest way to buy them is through an online stock broker. To do this, you need to open an account and follow a broker's procedures, then start trading. You can trade NuFarm Ltd. stock right from TradingView charts — choose your broker and connect to your account.
Investing in stocks requires a comprehensive research: you should carefully study all the available data, e.g. company's financials, related news, and its technical analysis. So NuFarm Ltd. technincal analysis shows the sell today, and its 1 week rating is sell. Since market conditions are prone to changes, it's worth looking a bit further into the future — according to the 1 month rating NuFarm Ltd. stock shows the sell signal. See more of NuFarm Ltd. technicals for a more comprehensive analysis.
If you're still not sure, try looking for inspiration in our curated watchlists.
If you're still not sure, try looking for inspiration in our curated watchlists.