RMS - RAMELIUS RESOURCES LIMITED (UPSIDE POTENIAL)Giving upside potential base don Elliott wave analyst. Currently this in wave 3 of Elliott wave in weekly charts.
Next report date
—
Report period
—
EPS estimate
—
Revenue estimate
—
0.05USD
41.00 MUSD
420.38 MUSD
1.10 B
About RAMELIUS RESOURCES LIMITED
Sector
Industry
CEO
Mark William Zeptner
Website
Headquarters
Perth
Employees (FY)
300
Founded
1979
ISIN
AU000000RMS4
FIGI
BBG000R52KH3
Ramelius Resources Ltd. engages in the development and exploration of mines. It operates through the following segments: Mt. Magnet, Edna May, and Exploration. The Mt. Magnet segment refers to mining and processing of gold from the Mount Magnet region. The Edna May segment focuses on the mining and processing of gold from the Edna May region. The Exploration segment includes exploration and evaluation of gold mineralization. The company was founded on May 4, 1979 and is headquartered in Perth, Australia.


TRIANGLE BREAKOUT To long RMS
Trade setup : breakout of Triangle
LIKE
Candle breakout from the top range.
With healthy size candle
Decent volume compared to last 5-6 candle
Above EMA in trend
DISLIKE
Price did not followup to break with momentum
Came back to retest
Overall bearish sentiment of market during open

RMS bulldaily = invesrse head and shoulders
and breakout of pruple trend line.
GOLD sitting just under $2K US.
gold price breakout is imminent and
the miners WILL follow in suit.

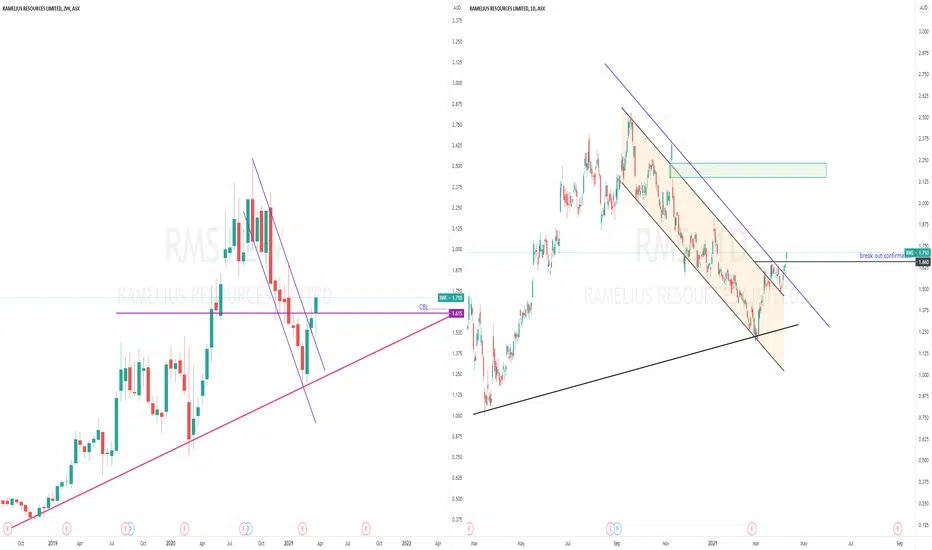
ramelius resources RMSgetting good support on trend line at $1.36 if keeps consolidating for few days should go long to 1.62 for about 15% gain 3-4 week time frame

$RMSRMS breakout with target market on the change
RMS broke out on decent volume.
Looking for a move above the "level" and then to see if it uses that same level as support. this will be confirmation.
The next level is the target that is marked on the chart and a potential profit taking zone for sho

RMS looking bullishRMS has broken through a longer term trendline with some bullish implications.
The price control line for the bars shown is at 1.715 and there has been significant trading here and through to 1.80 (seen by volume histogram on the right)
Buying volume has stepped in this week and Twiggs Money Flow l


bullish setup for RMSRMS charts looking bullish like most ASX gold miners.
the downtrend in price has paused and price
is looking to initiate a new up trend.
wait for the confirmation break on daily chart
and load up.

See all ideas
Trade directly on the supercharts through our supported, fully-verified and user-reviewed brokers.


Frequently Asked Questions
The current price of RMLRF is 1.27 USD — it has decreased by 7.97% in the past 24 hours. Watch Ramelius Resources Ltd. stock price performance more closely on the chart.
Depending on the exchange, the stock ticker may vary. For instance, on OTC exchange Ramelius Resources Ltd. stocks are traded under the ticker RMLRF.
RMLRF stock has fallen by 12.41% compared to the previous week, the last month showed zero change in price, over the last year Ramelius Resources Ltd. has showed a 46.58% increase.
We've gathered analysts' opinions on Ramelius Resources Ltd. future price: according to them, RMLRF price has a max estimate of 1.72 USD and a min estimate of 1.32 USD. Watch RMLRF chart and read a more detailed Ramelius Resources Ltd. stock forecast: see what analysts think of Ramelius Resources Ltd. and suggest that you do with its stocks.
RMLRF reached its all-time high on Sep 8, 2011 with the price of 1.81 USD, and its all-time low was 0.03 USD and was reached on Dec 23, 2014. View more price dynamics on RMLRF chart.
See other stocks reaching their highest and lowest prices.
See other stocks reaching their highest and lowest prices.
RMLRF stock is 8.66% volatile and has beta coefficient of 0.84. Track Ramelius Resources Ltd. stock price on the chart and check out the list of the most volatile stocks — is Ramelius Resources Ltd. there?
Today Ramelius Resources Ltd. has the market capitalization of 1.49 B, it has decreased by 0.46% over the last week.
Yes, you can track Ramelius Resources Ltd. financials in yearly and quarterly reports right on TradingView.
Ramelius Resources Ltd. is going to release the next earnings report on Aug 26, 2024. Keep track of upcoming events with our Earnings Calendar.
Ramelius Resources Ltd. revenue for the last quarter amounts to 237.26 M USD despite the estimated figure of 237.25 M USD. In the next quarter revenue is expected to reach 286.47 M USD.
RMLRF net income for the last quarter is 28.08 M USD, while the quarter before that showed 21.64 M USD of net income which accounts for 29.72% change. Track more Ramelius Resources Ltd. financial stats to get the full picture.
Yes, RMLRF dividends are paid annually. The last dividend per share was 0.01 USD. As of today, Dividend Yield (TTM)% is 1.02%. Tracking Ramelius Resources Ltd. dividends might help you take more informed decisions.
Ramelius Resources Ltd. dividend yield was 1.59% in 2023, and payout ratio reached 28.78%. The year before the numbers were 1.15% and 68.49% correspondingly. See high-dividend stocks and find more opportunities for your portfolio.
As of Jun 1, 2024, the company has 300.00 employees. See our rating of the largest employees — is Ramelius Resources Ltd. on this list?
EBITDA measures a company's operating performance, its growth signifies an improvement in the efficiency of a company. Ramelius Resources Ltd. EBITDA is 210.47 M USD, and current EBITDA margin is 43.28%. See more stats in Ramelius Resources Ltd. financial statements.
Like other stocks, RMLRF shares are traded on stock exchanges, e.g. Nasdaq, Nyse, Euronext, and the easiest way to buy them is through an online stock broker. To do this, you need to open an account and follow a broker's procedures, then start trading. You can trade Ramelius Resources Ltd. stock right from TradingView charts — choose your broker and connect to your account.
Investing in stocks requires a comprehensive research: you should carefully study all the available data, e.g. company's financials, related news, and its technical analysis. So Ramelius Resources Ltd. technincal analysis shows the buy rating today, and its 1 week rating is buy. Since market conditions are prone to changes, it's worth looking a bit further into the future — according to the 1 month rating Ramelius Resources Ltd. stock shows the strong buy signal. See more of Ramelius Resources Ltd. technicals for a more comprehensive analysis.
If you're still not sure, try looking for inspiration in our curated watchlists.
If you're still not sure, try looking for inspiration in our curated watchlists.