PHM - PulteGroup Inc. | Bullish Swing Trade Setup📈 Ticker: PHM (NYSE)
📊 Timeframe: Daily + 4H
🎯 Strategy: Swing Trading (3-10 days)
📅 Date: January 29, 2026
🎯 Trade Setup
Parameter Level Explanation
Entry Price $127.77 Break above resistance & 20-period SMA convergence
Stop Loss $121.00 Below recent swing low and 50-period SMA
Take Profit $141.76
Key facts today
Next report date
—
Report period
—
EPS estimate
—
Revenue estimate
—
11.21 USD
2.22 B USD
17.31 B USD
191.02 M
About PulteGroup, Inc.
Sector
Industry
CEO
Ryan R. Marshall
Website
Headquarters
Atlanta
Founded
1950
IPO date
Jun 29, 1983
Identifiers
3
ISIN US7458671010
PulteGroup, Inc. engages in the homebuilding business. The firm is also involved in mortgage banking and title and insurance brokerage operations. It operates through the Homebuilding and Financial services business segments. The Homebuilding segment includes operations from Connecticut, Maryland, Massachusetts, New Jersey, New York, Pennsylvania, Virginia, Georgia, North Carolina, South Carolina, Tennessee, Florida, Illinois, Indiana, Kentucky, Michigan, Minnesota, Missouri, Ohio, Texas, Arizona, California, Nevada, New Mexico, and Washington. The Financial Services segment is composed of mortgage banking and title operations. The company was founded by William J. Pulte in 1950 and is headquartered in Atlanta, GA.
Related stocks

PHM - Pulte Group — Triangle Compression | Breakout SetupHello Everyone, Followers,
PHM is the last one from my side and i believe we can make some quick wins on this one ;)
Lets drill down:
📌 Technical Overview
PulteGroup has confirmed a bullish breakout from its triangle consolidation pattern.
After weeks of compression between rising trendline su

PHM: Institutional Volume Drives BreakoutThe Setup: PulteGroup is one of America's largest home construction companies. As the sector continues to show resilience against rate uncertainty, PHM is signaling a major technical alignment across multiple timeframes.
Technically, the Monthly chart displays a distinct Cup and Handle, setting the

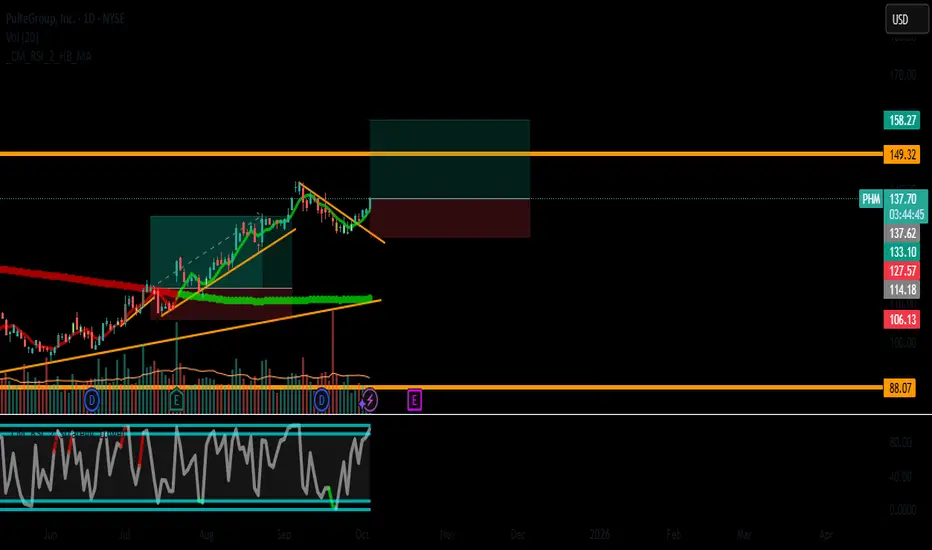
PulteGroup, Inc. - Swing Trade SetupNYSE:PHM - PulteGroup, Inc. - Swing Trade Setup
High-probability breakout play in homebuilding sector
🎯 TRADE PARAMETERS:
Direction: LONG
Entry: $137.57 (on pullback or breakout confirmation)
Stop Loss: $127.57 (-7.3%)
Take Profit: $158.27 (+15.1%)
Risk/Reward Ratio: 1:2.1
📊 TECHNICAL ANALYS
PHM: Fundamental Analysis +45%With 2024 revenue of $17.95 billions, PulteGroup is an american homebuilding company. EverStock identifies a fundamental revaluation potential of +45 %.
Valuation at 8.4 x net earnings :
Currently valued at $25.88 millions in market capitalization, PulteGroup posted a profit of $3.08 billions in it
Buy of breakoutUptrend
As you can see, the chart is in an uptrend. It has reached a resistance trend line and has reacted to it. I have found that trading based on price levels has been very effective for me. I am now waiting for a strong confirmation above this level, around 122. My estimate is that the price co

PHM (PulteGroup) – High-Probability Swing Trade Setup📈 Symbol: PHM (PulteGroup)
⏳ Timeframe: Daily Chart
⚡ Strategy: Swing Trade (2-4 Weeks)
🎯 Trade Setup
Entry Zone: $114.00 (Daily SMA 20 + Psychological Support)
Stop-Loss (SL): $104.80 (8% below entry, below SMA 50)
Take-Profit (TP): $133.10 (+16.7% upside, Historical Resistance)
Risk-Reward Rati

PHM CHART UPDATE PHM top rejection trend in red.
Bottom support in Green.
Mid term support and rejection show in light green and red.
All price targets labeled.
Trends extended.
Ghost feed is a guideline.
Careful above 180.
Careful into earnings it looks like a drop to stable levels around 94 to mid 80's which thes

$PHM with a bearish outlook following its earnings #StocksThe PEAD projected a bearish outlook for NYSE:PHM after a negative under reaction following its earnings release placing the stock in drift D with an expected accuracy of 44.44%.

PHM UPDATED CHART - What's NEXT?What's next?
I'm not certain, but it looks like price can hold this key zone and use the rejection trends to bounce upwards to the 184 target (which is adjusted upward from 170).
RSI on the weekly is somewhat gapped, but bullish.
RSI on the daily is bullish.
RSI on the 4, 2 and 1 are near bottoms,

See all ideas
Summarizing what the indicators are suggesting.
Neutral
SellBuy
Strong sellStrong buy
Strong sellSellNeutralBuyStrong buy
Neutral
SellBuy
Strong sellStrong buy
Strong sellSellNeutralBuyStrong buy
Neutral
SellBuy
Strong sellStrong buy
Strong sellSellNeutralBuyStrong buy
An aggregate view of professional's ratings.
Neutral
SellBuy
Strong sellStrong buy
Strong sellSellNeutralBuyStrong buy
Neutral
SellBuy
Strong sellStrong buy
Strong sellSellNeutralBuyStrong buy
Neutral
SellBuy
Strong sellStrong buy
Strong sellSellNeutralBuyStrong buy
Displays a symbol's price movements over previous years to identify recurring trends.
PHM.GP
PulteGroup, Inc. 6.0% 15-FEB-2035Yield to maturity
5.00%
Maturity date
Feb 15, 2035
PHM.GL
PulteGroup, Inc. 6.375% 15-MAY-2033Yield to maturity
4.72%
Maturity date
May 15, 2033
PHM.GJ
PulteGroup, Inc. 7.875% 15-JUN-2032Yield to maturity
4.67%
Maturity date
Jun 15, 2032
PHM4340139
PulteGroup, Inc. 5.5% 01-MAR-2026Yield to maturity
4.37%
Maturity date
Mar 1, 2026
PHM4388482
PulteGroup, Inc. 5.0% 15-JAN-2027Yield to maturity
4.20%
Maturity date
Jan 15, 2027
See all PHM bonds
Frequently Asked Questions
The current price of PHM is 135.09 USD — it has increased by 0.32% in the past 24 hours. Watch PulteGroup, Inc. stock price performance more closely on the chart.
Depending on the exchange, the stock ticker may vary. For instance, on NYSE exchange PulteGroup, Inc. stocks are traded under the ticker PHM.
PHM stock has risen by 6.21% compared to the previous week, the month change is a 10.34% rise, over the last year PulteGroup, Inc. has showed a 21.34% increase.
We've gathered analysts' opinions on PulteGroup, Inc. future price: according to them, PHM price has a max estimate of 159.00 USD and a min estimate of 115.00 USD. Watch PHM chart and read a more detailed PulteGroup, Inc. stock forecast: see what analysts think of PulteGroup, Inc. and suggest that you do with its stocks.
PHM stock is 4.04% volatile and has beta coefficient of 0.53. Track PulteGroup, Inc. stock price on the chart and check out the list of the most volatile stocks — is PulteGroup, Inc. there?
Today PulteGroup, Inc. has the market capitalization of 25.78 B, it has increased by 1.68% over the last week.
Yes, you can track PulteGroup, Inc. financials in yearly and quarterly reports right on TradingView.
PulteGroup, Inc. is going to release the next earnings report on Apr 28, 2026. Keep track of upcoming events with our Earnings Calendar.
PHM earnings for the last quarter are 2.56 USD per share, whereas the estimation was 2.81 USD resulting in a −8.96% surprise. The estimated earnings for the next quarter are 1.85 USD per share. See more details about PulteGroup, Inc. earnings.
PulteGroup, Inc. revenue for the last quarter amounts to 4.61 B USD, despite the estimated figure of 4.33 B USD. In the next quarter, revenue is expected to reach 3.42 B USD.
PHM net income for the last quarter is 501.61 M USD, while the quarter before that showed 585.83 M USD of net income which accounts for −14.38% change. Track more PulteGroup, Inc. financial stats to get the full picture.
Yes, PHM dividends are paid quarterly. The last dividend per share was 0.26 USD. As of today, Dividend Yield (TTM)% is 0.69%. Tracking PulteGroup, Inc. dividends might help you take more informed decisions.
PulteGroup, Inc. dividend yield was 0.78% in 2025, and payout ratio reached 8.27%. The year before the numbers were 0.75% and 5.58% correspondingly. See high-dividend stocks and find more opportunities for your portfolio.
As of Feb 7, 2026, the company has 6.51 K employees. See our rating of the largest employees — is PulteGroup, Inc. on this list?
EBITDA measures a company's operating performance, its growth signifies an improvement in the efficiency of a company. PulteGroup, Inc. EBITDA is 3.09 B USD, and current EBITDA margin is 17.86%. See more stats in PulteGroup, Inc. financial statements.
Like other stocks, PHM shares are traded on stock exchanges, e.g. Nasdaq, Nyse, Euronext, and the easiest way to buy them is through an online stock broker. To do this, you need to open an account and follow a broker's procedures, then start trading. You can trade PulteGroup, Inc. stock right from TradingView charts — choose your broker and connect to your account.
Investing in stocks requires a comprehensive research: you should carefully study all the available data, e.g. company's financials, related news, and its technical analysis. So PulteGroup, Inc. technincal analysis shows the buy rating today, and its 1 week rating is strong buy. Since market conditions are prone to changes, it's worth looking a bit further into the future — according to the 1 month rating PulteGroup, Inc. stock shows the buy signal. See more of PulteGroup, Inc. technicals for a more comprehensive analysis.
If you're still not sure, try looking for inspiration in our curated watchlists.
If you're still not sure, try looking for inspiration in our curated watchlists.