Trade #12 iExec RLC Man im tired to typing lol
All detail available on chart.
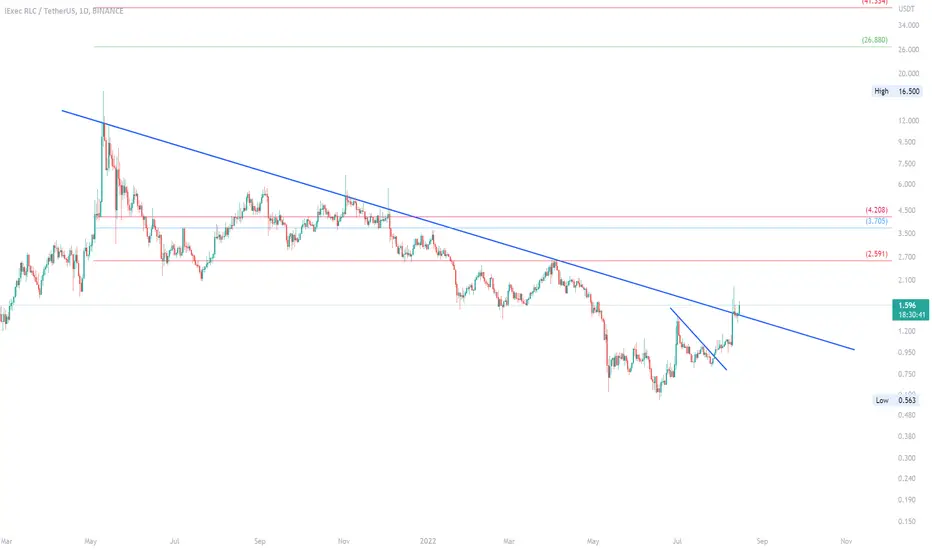
Entry 1.1078
SL 1.0903
Take Assets : 1.3452
Possibility reach price 1.46 - 1.51
If there's confusing detail reach me on message
Better Open this link on PC/Website
RLCUSDT trade ideas

iExec RLC/USDT - 2000%+ Potential growth if history repeatsBetween 2020 - 21 RLCUSDT formed a solid base with 4x monthly candles before seeing growth of 2000% percent. Now in 2022, we have again formed a strong base of support with 4x monthly candles, and have just gone above a long term resistance line. If history repeats, RLC could reach a price of $22 which is 2000%+ increase from the base of the 4 - 5 most recent monthly candles. Stochastic RSI also looking good.

RLC/USDT NEW SETUP 👴Hi 🖐
In the photo, I fully explained that to reach the price of the ceiling and the liquidity floor it should consume which area, but although the liquidity trend is broken, I would probably first get high in liquidity, because at the higher timing the price is downward and the changing nature of the creature is created. .
In general, in each resistive or support area, the lower time gave the lower time to enter the position. I have helped you so far with you.
Goodluck 🌟

RLC CAN MAKE A CORRECTIONFrom the announcement area it can form a minor correction. You must be careful that the larger structure is not yet bearish

RLC/USDTRLC/USDT
He broke the roof of his channel and fixed it above it.
If it maintains this range, it can grow to the specified targets.
#RLCUSDT #RLC #BTCUSDT #BTC #ETHUSDT #DOGE #DOGEUSDT

RLC broke out falling wedge#RLC/USDT
$RLC broke out from 4h falling wedge pattern.
🐮 possibly price will do a pullback to the broken line that is around support zone, then can continue its upward move to touch resistance zone around $1.6.
🐻 if price break down from support zone it will drop to next support and lower line of wedge.

RLC falling wedge#RLC/USDT
$RLC is inside a falling wedge pattern, above the lower line, and below the resistance zone.
🐮 break out from current resistance zone will increase price toward upper line of wedge, and if successful to break it out, it will continue the upward move to prices above $1.7.
🐻🐮 rejection from current resistance can drop price to lower line of wedge which is the same with support zone, and after that maybe attempt to break out this pattern.
🐻 but if price going to break down from lower line of wedge this analysis will be invalid and price can fall to $0.8

Do You Know About RLC USDT ❓🟧 RLCusdt
⏰ Weekly
📅 SEP / 04 / 2022
✴️ It is Down Trend and has Dynamic Resistance.
🔶 We can see more details in the lower time frame.
🔸 I will show details in another chart. please follow my analysis .
📛 Follow the market trend and decide to buy or sell.
⚠️ (This isn't a signal for buy or sell) ⚠️
..........................................
#️⃣ 13 / 06 / 1401
👸 Analyzed by : Parisa_Alipoor
..........................................

RLCUSDTRLCUSDT, is forming a W bottom, eyes on a volume increase on break. we should see 50+%, on break.

iExec RLC formed bullish Gartley for upto 88.50% moveHi dear friends, hope you are well and welcome to the new trade setup of iExec RLC token with US Dollar pair.
On a daily time frame, RLC has formed a bullish Gartley pattern.
Note: Above idea is for educational purpose only. It is advised to diversify and strictly follow the stop loss, and don't get stuck with trade

RLC i will long at bluei checked Fibo points with many place. And i saw same zone (blue one) to long.
Lets go


RLC WILL BECOME A HYPE COIN AND THIS IS WHYDear traders,
The most tokens that did increase well - there was always a data that we could study before the increase, and with years of experience, i did mix the data from other increase to see witch coin have the possibility to have the coming green cycle increase - and found that RLC are one of the coins that could enter into the new hype with high %.
Know that crypto markets can be always risky, and that there is no guaranty for any increase - it deepens all on higher chance.
And yes RLC have the chance, and with the time we will see or this green cycle that did confirm if it will go further, and if that happen, we would enter new high targets .
When the spot whale increase starting more, as the DCA wallets starting to increase - we will see this coin entering higher ranges.
Depending on TA - this could only be the start for a new range increase of this coin.
Prices changes now in some cents range by RLC, if the whale trend getting entering, the trade will changing in much higher volume, what could entering dollars range changing in short term.
Its not about fast trade as its cycle trade - it depend on patient and follow to get right in this coin.
This article are not a trading advice.

LRC SHOWS A SIGNAL OF BREAKOUT FOR NEW HIGHDear traders,
LRC shows on long term a breakout signal view what even can go above the 3 usd - this depending on the TA study and volume ranges of the coin.
Its important that LRC get over the 1.80 to make new trend to the breakout.
LRC is one of the top coins that have a view for breakout coming time.
Also depending on whale wallet show - it seems its positive increasing, what this mean the time will show it.
Unexpected trends could happen coming time on this coin, as some volume structures shows this coin could have soon a breakout.
This not a finance advice, trade safe.
- LRC trading now stable - and on low time frame it shows not much effect.

RLC - THE NEW INCREASE TIME RLC Seems to be ready for new increase - on the low time frame
Its one of the interesting coins at the moment.
Targets.
Possibility between 10% -55 %
# No any idea of this channel is a finance idea.

From wyckoff accumulation to wyckoff distributionPrice make bc, ut and utad after it showed sow and playout and if we compare to the price of previous swing it surpass to its priçe and consider as a ut.

RLC up to 3R or 5RRLC long idea. Targets based on actual risk. 5R potential for 1 trade. 3R potential for the higher risk trade. The higher the R, the less likely it is to reach that price. R=Risk. 1H chart

Wyckoff with smc strategyPresently price action makes higher high more possibility it is the buying climax after that is the automatic rally where the current trends leave more embalances which possibly metigation take upon.


RLC, possible further downside... Hey, we had some green wave the last couple of weeks but back to ongoing downtrend. Looking at RLC, Im expecting a solid short opportunity. What do you think?

dipped to trend support zone! ⛄as expected/predicted in my last analysis... after a double top rejection from RSI and rejection from trend resistance, RLC saw a dip to the pivot zone/trend support.
now on the break of 1.446 a rally to 1.85-1.95 is likely! also check out the RSI now, almost a perfect bounce from trend support.

Bull FlagOversold 4hr rsi and stoch rsi, price holding 200ema, declining volume, hidden bullish divergence, and macd turning light red. Bullish divergence on 15min and oversold stochastic rsi. Price also bouncing off daily inverse head and shoulders neckline. 15min cup and handle holding still.