SANDUSDT MARKET CYCLE PERFECTHi,
sand usdt following market cycle cheat sheet by wall street.
what i'm seeing here we are going through ANGER phase.
END IS ALMOST NEAR.
STAY ACTIVE
SANDUSD trade ideas


SAND is @ do or die, can it pull a SHIB & move ^?IF $SAND can break this UGLY downtrend, very likely if $ETH keeps moving, we could see 🚀🚀🚀
Look @ #SAND 80-130 area
Tends to have $ coming in time to time
A lot of do or die scenarios lately - Rectangle
Weekly shows this better for #sandbox
#p2e #metaverse #nft #crypto

SAND - Wait For The Bulls!Hello TradingView Family / Fellow Traders. This is Richard, as known as theSignalyst.
on WEEKLY: (Left Chart)
SAND is sitting around a strong demand zone in blue so we will be looking for buy setups on lower timeframes.
on H4: (Right Chart)
SAND formed a valid wedge pattern in red. but it is not ready to go yet.
For the bulls to take over, a momentum candle close above the last major high (in gray).
Meanwhile, until the buy is activated, SAND can still trade lower inside the blue demand zone (0.5 - 0.7)
In this case, we will be looking for new buy setups to form.
Always follow your trading plan regarding entry, risk management, and trade management.
Good luck!
All Strategies Are Good; If Managed Properly!
~Rich

SANDUSD (4H) - Bullish reversalHi Traders
SANDUSD (4H Timeframe)
Waiting for the upward break of 0.797 resistance level, which will complete a bullish trend reversal pattern to go LONG. Only the downward break of 0.743 would cancel the bullish scenario.
Trade details
Entry: 0.797
Stop loss: 0.743
Take profit 1: 0.830
Take profit 2: 0.880
Score: 4
Strategy: Bullish reversal

Sandbox PumpingWhy Is Sandbox Pumping?
Binance US to list Sandbox, $SAND October 5, 2022.
Noteworthy:
Do not forget the historical wise saying, "Never invest more than you can afford to lose."
Not a financial advise, I suggest using this only as a guide - Do your own research.
Let us know what you think about this subject in the comments section below.
Kindly support this idea with your like and comment, thank you.

SAND/USDT Elliott Wave count 45min TFSAND may move to the upside with a Head and Shoulders pattern.
Wait for a clear breakout at 0.8984 to entry long with take profit at next resistance if this upisde move is a corrective pattern WXY.
It also may move more to the upside if this is an 12 12.
Good luck!


SandSAND/usdt, the triangle has been broken and the channel is tested, it will return to test the previous resistance as it is clear, then the reversal will be in the direction

SANDUSD (4H) - Bullish reversalHi Traders
SANDUSD (4H Timeframe)
Waiting for the upward break of 1.002 resistance level, which will complete a bullish trend reversal pattern to go LONG. Only the downward break of 0.905 would cancel the bullish scenario.
Trade details
Entry: 1.002
Stop loss: 0.905
Take profit 1: 1.060
Take profit 2: 1.156
Score: 4
Strategy: Bullish reversal

SANDPERP Where The Bull Startmarket structure is bearish, trend direction is to liquidity zones which are shown with the $ sign.
My expectation is after taking out the liquidity below target will be the liquidity at the top and supply zone shown as "target".
If any structure break (after liquidity grab) at ltf i'll be in the bus.
EDIT: Once the first liquidity is taken, also waiting for long position from which will be ; after fibonacci %50 is breached will be waiting at %70 fibo level for long position

Sand has a very similar inv h&s to mana2 potential necklines here..this descending white one and the more conventional horizontal one in yellow..wouldn’t surprise me that if one of them validates they both do. *not financial advice*

Huge Upside Potential Inverse HnSAfter a long down trend SANDUSD has formed Inverse Head & shoulders Pattern
Can go long after breakout

Trying to push up just 2 hours befor ulock for exit liquidity !Sand short !
Unlocking just in two hours. 500 M entering the market

Saturday 10:00 AM UTC SAND will unlock 12.4 % (!!!) of his TokenBINANCE:SANDUSD
Saturday 10:00 AM UTC SAND will unlock 12.4 % (!!!) of his Tokens, which has been locked until now.
You can imagine what is going to happen ! Extreme sell pressure since lots of Investors will try to make profits now
Currently this equals to about 500 Million USD tokens being unlocked at once on Saturday.
Have FUN !

SAND - Think Outside The SANDbox!Hello TradingView Family / Fellow Traders. This is Richard, as known as theSignalyst.
SAND rejected a strong demand zone and round number 1.0 so we will be looking for buy setups on lower timeframes.
on DAILY: SAND formed a valid inverse head and shoulders but it is not ready to go yet.
For the bulls to take over, we need a momentum daily candle close above the gray neckline and red trendline.
🎯Targets => Our first resistance / target would be around 2.65 so I will be monitoring price action there.
If we break it upward (purple projection) then a movement till 4.7 would be expected.
Meanwhile, until the buy is activated, SAND can still trade lower inside the demand zone.
Always follow your trading plan regarding entry, risk management, and trade management.
Good luck!
All Strategies Are Good; If Managed Properly!
~Rich

SANDUSD (1H) Bearish breakoutHi Traders
SANDUSD (1H Timeframe)
The market is in a downtrend and we are waiting for an entry signal to go SHORT below the 1.273 support level. Only the upward break of 1.350 would cancel the bearish scenario.
Trade details
Entry: 1.273
Stop loss: 1.350
Take profit 1: 1.226
Take profit 2: 1.150
Score: 4
Strategy: Bearish breakout


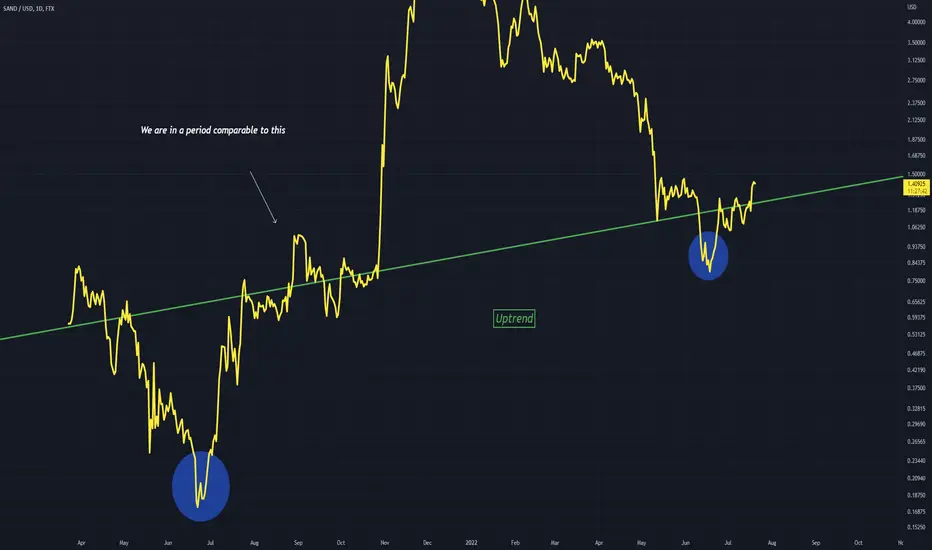
SANDUSD - Comparable Period Sand is maintained an uptrend, and has produced similar lows with a low volatility phase following this low
Arrow shows the comparable period of low volatility
The blue area could be viewed as a head of an inverted H&S
Sand is about to break the range?One more altcoin that is struggling to break the range.
Sandbox still in range.
As long as it remains inside this it’s not wise to go long. Instead wait for the flip of $1.49 and then open your longs.
The resistance level near $2.05 is quite weak but it can stop a possible short-term pump.
However, the real challenge for bulls is the $2.65 resistance.

Sandbox upside potential If we get a break here in previous resistance and price makes a new higher high, this crypto will go back up again to $3 dollars.

SANDUSD ❕ downward channelSAND is moving in a downward channel.
The price is under liquidity.
Main MAs are bearish (1H TF)
Price is testing the 100MA as resistance (1H TF)
I expect price to continue to decline after fixing in the channel.

Head and shoulders Enteri: 1.10_1.15
Sl: 0.95
Tp1: 1.73
Take profit zone: 1.93_1.96
🚨cross moving 100&200 in 4H time
🚨head and shoulders
🚨FOLLOW FOR MORE
