GILD trade ideas

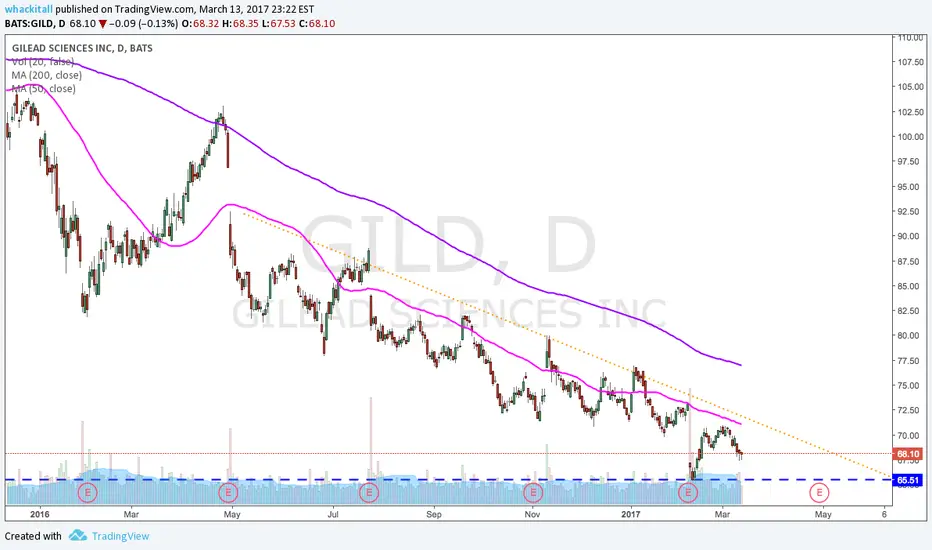
Descending WedgeI do not believe we fall below the important support level drawn by the red line. It had shown as vital support in the past and i believe we will see the same here. A further decline does not seem warranted also because of the RSI's divergence to declining prices showing that strength is increasing. After such a decline we should see a breakout to at least Fib 50% from GILDs High to its current price which January Calls look appetizing at the moment as a large move is not expected. Both calls and puts show high OI but this is something I will definitely keep an eye on. GILD is a solid company.


Earnings trade in GILD (Spiked Lizard)This is a neutral trade with no risk to the upside. Its like a straddle with protection to the upside, then selling a ratio spread to move our break even down (Doubling our risk to the downside) The trade is called a spiked lizard by Liz and Jenny. The expected move is around $3 and we have an IVR of 60. With an expected 40% vol crush, lets see how this trade goes.
Our Break even is at 64.93
The trade:
-2 65 Put
+1 66.5 Put
-2 69 Put
+1 71.5 Put
We got $0.11 credit. Max profit is $261.


GILD can be a long candidate..Hello all
I came across this interesting set up which i wanted to share. Let's take a look at GILD..
Weekly: Strong downtrend. Only thing to see is macd has no momentum now to downside.Ha delta about to go above zero line.
Daily: Its been in downtrend from a year now. Did not follow any rally in indices. So, earnings are coming up this week. There is also a trendline in play here. Macd showing some momentum to upside and hadelta is above zero. Let's see the reaction to earnings and if it breaks above cloud, i don't mind playing it to long side.
There will also be gurus telling you that market is crashing now and tomorrow. But look at the chart and trade what you see. If it is breaking out, its a long. If it is breaking down, it is a short.
Happy trading.

GILD - Signal confirmation11.04.17
After almost 10 months we got a signal.
Signal of a potential bottom from BOTH of my dBFIs on the DAILY chart
Awaiting confirmation (close above sma14).Signal valid for 2 weeks.
25.04.17
Signal confirmation

GILD - POTENTIAL BOTTOMAfter almost 10 months we got a signal.
Signal of a potential bottom from BOTH of my dBFIs on the DAILY chart
Awaiting confirmation (close above sma14).Signal valid for 2 weeks.

Long Position in GILD After Bullish BounceAbout a week or so ago, I published an idea about GILD hitting some serious support levels going back to mid to late 2014 - 2015. What I thought back then was that if GILD were able to hold on to that support level, even bounce around it without falling below it, I would enter a position in my paper account at that support level, and place my stop below the support line. So, if my stop is triggered, it signals that my thesis was wrong, and perhaps that I should try it on the short side (still working with ways of changing direction on a time to profit even when my hypothesis is wrong.
Anyways, let's look at the trade. I risked 1.0% of my portfolio with a stop loss at $63. I didn't set any profit targets, and I think I'm going to keep not setting profit targets. The reason being is I want to make sure that I am being diligent in moving my stops with the direction of the trend (if I am right), and let the profit take care of itself.
Trying to stay discipled in capital risk management, and I am getting more confident with it.
All the best,
RC


GILD - Where is the bottom?Where is the bottom? I absolutely DO NOT have the answer.
Volume corresponding to GILD price is interesting. I don't often look at 1M, but it does give an interesting perspective.
Short interest is .98%. I'ts been dropping since 2013.
1W:
1M CELG Comparison:

GILD hitting Major Support LineGilead Sciences is a deep value play, along the likes of a Joel Greenblatt "Magic Formula" stock. Around September I expressed a bullish interest in GILD given its fundamentals and its valuation. During that time, GILD traded at $73. Since I expressed a long interest, the stock has done nothing but decline. Looking back on my initial bullish opinion, I didn't take into consideration the charts, let alone even think about TA.
The fundamental research was over, and due to the fundamentals I didn't really think to take a look at the charts. After all, it was my inner Buffett saying, "Hey, this is a great business, don't even worry about the price, since the company is so great, it doesn't matter. Heck, if it goes lower, buy more!" Well, after reflecting on this consensus I realized how foolish it was of me.
If I would've taken the time to look at the charts, I would have realized that at $73, it didn't have much support on that level, with the most recent support level being at $66.51. So, instead of waiting for that support price to hit, I thought it would be a good idea to buy at $73. Not only did that bullish decision reflect in a loss of capital, but it resulted in dead money, money that could've been used in other capital allocations.
Nevertheless, I like GILDs fundamentals so much I had to take a second look as the share price kept falling. Now, at $66.51, GILD is right at the support level from mid 2014. GILD is still in a bearish channel, but since the company is so solid on its balance sheet and has loads of cash, if the bearish channel is broken upward, I will look to get in around the $71 level.
Will keep watching.
All the best,
RC


Gilead head and shoulders pattern. Levels of support if the head and shoulders pattern continues is $68, $53, and $38.


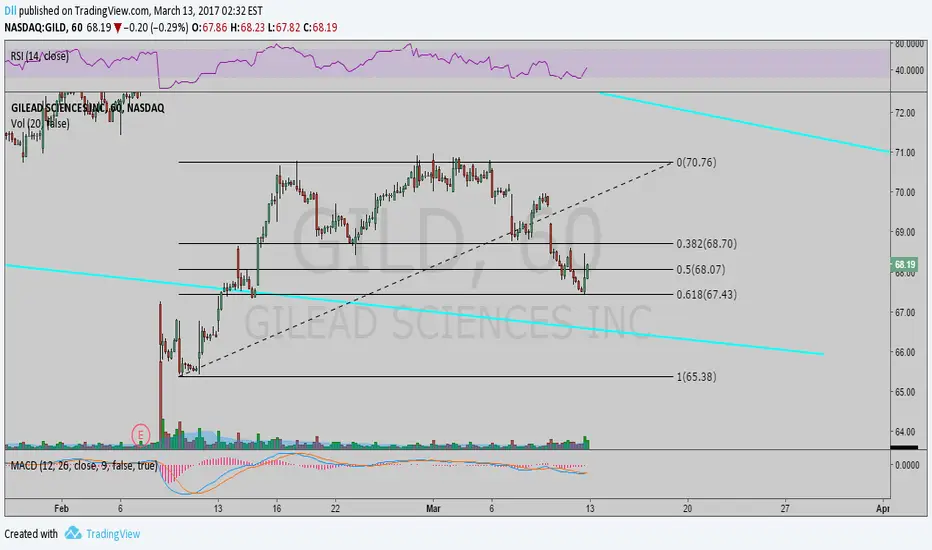
GILD short opportunityGILD recently bounced to its .618 retracement on what is likely a short squeeze via trading algorithms at the open. Enter this puppy short for the next downside wave.
Target should be $65.