Synthetix (SNX) to $400 by April 2022This is one token that has certainly not shone throughout 2021 following a 80% correction since February, however I believe that’s about to change. Why?
** significant developments on the weekly chart **
1) On the above weekly chart price action has been trading inside a rising channel. Have been watching the price action resistance closely over the last several months. That resistance is now broken after almost 200 days.
2) Price action recently broke through the 21-week EMA (yellow) and 50-week EMA (green).
3) On 2-week chart (below) a ‘dragonfly DOJI’ candle was printed and confirmed. I’m always fascinated by this signal. On the 4hr / daily charts they are significant as they are the weekly. On a 2-week chart a DOJI like this is equivalent to a stack of dynamite. Don’t ignore it!
4) Lastly the daily chart. Following a ‘great buy’ signal, price action has begun to print higher lows. In addition, a hidden bullish divergence is printing between price action and Stochastic RSI for the past 30 days.
Is it possible price action falls further? Sure.
Is it probable? Unlikely.
A buy from < $12.40 is excellent
1st near term target is $33
Good luck!
WW
2-week chart:
1-day chart - hidden bullish divergence
SNXUSDT.PS trade ideas

SNX BULLISH SETUPSNX can make a bullish swing to the following targets. The asset has currently gained great volume since the violation of R1.
For BTC volatility check out the BTC dominance chart below 👇🏻

SNX/USDT is making semetrical triangle SNX/USDT
He is making setime frame is 4 hour
metrical triangle on 4 hour time frame
more chances have to breakout because its shows bullish divergence on one day time frame
Keeep eyes on it
Dyor

SNXUSDT update by vicWe are BULLISH so we are expecting a pump from the buyers as you can see
50ma,200ma above price FIRST confirmation
Inside the ichimoku cloud but trying to break above SECOND confirmation
Just as technical analysis would say✌️💯
I trade base on technical analysis
Not a financial advice
Share
Thanks for reading
GOOD LUCK TRADERS

SNXUSDTSNX trading in a ascending channel and is likely to move towards North once it starts to sustains above 11.80.
Next established targets would be around 13.65 followed by 16.80 and channel top around 17.40. SNX needs to trade above 9.30 in order to keep this idea validated.

SNX about to drop 80% ?based on the bar pattern of july-october 2020 .
I'll stay away from this in the next future

SNX/USDT Trade Setup. Expecting 40% growth!!!SNX broke above the falling wedge, and currently, it is at the retest zone. Expecting a good profit of 30% to 40% from the entry-level.
Entry: $9.832 to $10.102
Stop Loss: $9.04
Targets:
$11.16
$11.94
$12.78
$13.05
Accumulate the dip to average your entry.
Note: This is not financial advice. I have done my own research and trading at my own risk. So, do your own research before investing.


snxusdtsnx serious dip, keeping an eye on resistance level if bulls will save this token.
Strong rejection at 11-12 will send it back to 9
trade safe.....

Synthetix (SNX): Looking for Areas to Go LongWe're seeing a market-wide pullback at the moment and gives us a chance to find areas that we are interested in adding to our SNX bags.
Here's what I'm seeing on the Synthetix chart.

SNXUSDT Short TermPrice is in demand zone, good area to buy. Assuming BTC holds, SNX should be making its way up.
SL: depends on how lenient you are
Crypto fear and greed index is in extreme fear - you know what that means.
Good luck, not financial advice, trade at your own risk.

#Synthetix #SNX 4H Chart Analysis#Synthetix #SNX 4H Chart Analysis
Analysis based on RD+ divergence formation, valid channel formation, and triangle formation
targets:
1- 11.8$
2- 12.9$
3- 14.1$
stop loss: 9.2$
time: 3D-2W

SNXUSDTAfter the formation of wave ii, we must wait for the beginning of wave iii
Wave iii started low but will continue to be strong
If God wills :)

SnxusdtDisclaimer:
Currency trading have large potential rewards, but they also have large potential risk. You must be aware of the risks and be willing to accept them in order to invest in these markets. This is neither a solicitation nor an offer to Buy/Sell.

Triangular pattern broken upside BULLISH
triangle chart pattern represents a period of consolidation before the price is forced to breakout or breakdown. A breakdown from the lower trendline marks the start of a new bearish trend, while a breakout from the upper trendline indicates the start of a new bullish trend
TAKE TARGET ON CHART

SNX final chartWe are at the last phase of this bull cycle and SNX about to do 20x from current price. See u all in 2022.

SNX USDT LONG SWING TRADE | SNXUSDT | LONG @ 10.5 - 11 | TP @ 11.5, 12, 12.5, 13, 13.5 | SL @ 9.5 | PATTERN = N/A |
Testing my first swing trade on TradingView, not my first swing trade ever. PNF chart on the hourly shows a trend reversal.
The strategies I use involve a mix of PNF and Renko. My type of trading is strictly swing trading.

SNX USDT LONGsnxusdt buy
After a period of rest, hold the time to move and reap the benefits in the coming weeks


SNXUsdt UpdateFrom now on, I will try to set goals that are a little more precise, but less and longer
Because I know my friends who follow me are not interested in leverage and my chart is not too busy like this.
GL Frinds
dont panic
we close to back bullish market
more BTC Fall we shoould reset all analyse and thinking again what happen but we think this is normale and BTC rdy for 3 waves
can see both scenario on chart
GL
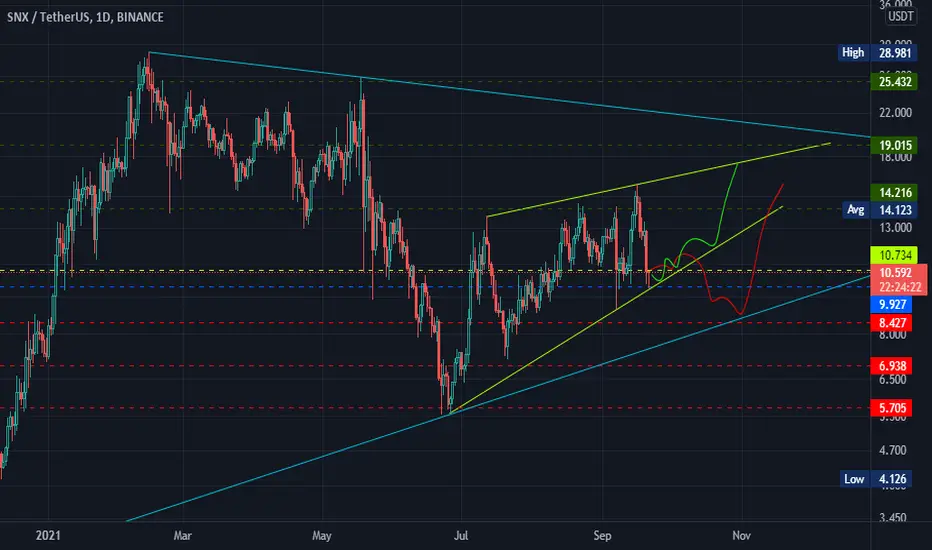
EntryoPoint:
9.927
Supports:
8.427
6.938
Resistance:
10.734
Targets:
14.216
19.015
25.432
38.446
For HODL:
65.107
Little patient
GL