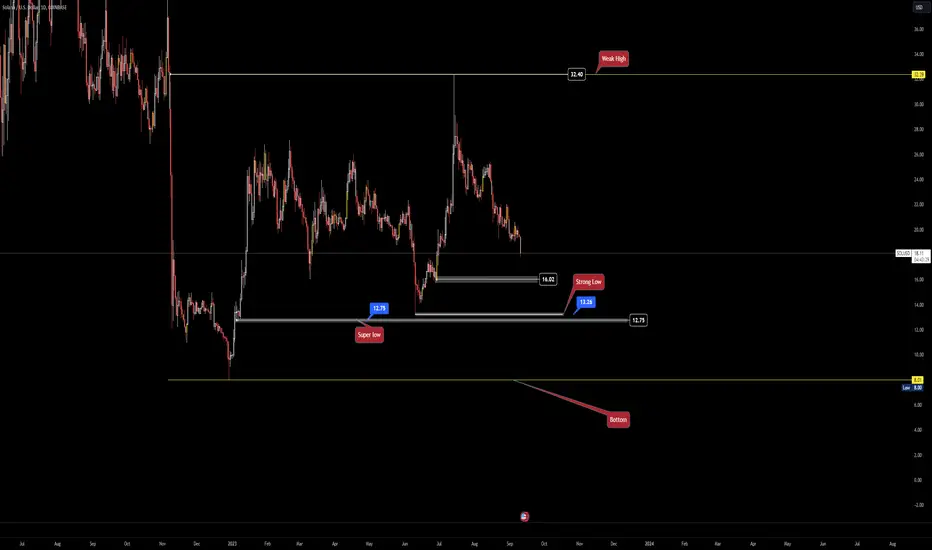
Solana closer lookZoomed in, couple extra additions.
My next update will be made with a fresh chart that day, maybe a week from now.
I aim to continue being profitable and would love others info/ideas. I have open ears and no crystal ball.
SOLUSD trade ideas

Solana has solid potentialThey might want to pump it up so they can give more money to one party and special interest groups rather than selling at this level... SBF & company might be able to get a better deal and or less prison time.
Currently I see support under us and upside. Wish I would have not bought when I did BUT it isn't that bad.
I plan on selling near purple box and adding to my bag maybe first week of October.
Stay safe and DO NOT BELIEVE THESE MOON BOYS. Just my opinion not investment advice.
Peace & Love

Sol looking to correct to 15.7 or 12.2 rangeSolana looking to dump to said levels after the fud bomb from ftx. It is a bad sign if a sell off like this has already occurred before the dump, we might see all-time lows. Regardless the token community is strong, developers like it , and some of my favorite projects are moving to solana (such as render).

SOLANA BACK TO 8USD?BINANCE:SOLUSD BACK TO 8USD
After the issue of POLONIEX:FTTUSDT liquidating solana from its wallet COINBASE:SOLUSD immediately fell 8% from the price of 19.40 USD, so then where is the bottom?
From the current price of 18.07 USDT then the next CRYPTO:SOLUSD price will be at 16.02 to go down in demand then if from demand it can't then there will be a drop to 13.26 USDT to 12.75 USDT!
This is very terrible if OKX:SOLUSDT the super low area cannot increase the price of the ETF results in the next month then MEXC:SOLUSDT will be at a price of 8 USDT at the bottom of 29 December 2022.
Soludt selling pressure Solusdt is not looking good here we may see more dump in future due to FTX selling NEWS. Currently solusdt is sitting at local support zone , if this support area breaks we will see more dump in sol upto next support of 12-13$.
.
.
.
.DYOR!!!!

Solana heading south The Solana price appears poised for a potential decline, with the 50-day Simple Moving Average (SMA) at 19.71 being the crucial level that could provide support. Based on weak recent performance, except for the period following the Visa announcement, I personally anticipate a breakdown.

21.77...?Trading the range, im looking for up to 21.77 on SOL. She likes to make these narrow pops that match large buys / sells that are visible on TOTAL indexes, but they sometimes make narrow bullish harmonics also, if you want to read it like that. I dont use the harmonic aspect of this personally, but i do consider SOL a leading indicator in conjunction with other factors.

SOL Price Under Retest, Will Buyers Rise Past $20?SOL price is currently retesting after breaking below the support trendline.
Solana's price has bounced back to $20, aiming to retest the broken trendline.
Despite January's gains, SOL's overall movement has been sideways.
Solana is still up 99% year-to-date.
The recent drop from $28 indicates a possible steeper correction due to overall market bearishness.
During a 30% price drop, SOL broke below the $20 mark and the 38.20% Fibonacci level.
Current price at $19.92 shows a post-retest reversal from the 38.20% Fibonacci level at $20.65.
If the downtrend continues, SOL might drop to $16.42, which is the 61.80% Fibonacci level.
A recovery above $20 might start a positive cycle within the current falling channel, targeting the $23.60 level.

✴️ A Close Look At Solana, Candlestick Reading + Elliot WaveThis is the 4-September candle for Solana (SOLUSD), yesterday:
This is either indecision or continuation.
Today's candle is bullish. Bulls and bears fought and the bulls are winning, volume is rising.
Looking closer, the 4H timeframe, we get additional clues...
The last three candles are all green, with the last one being a full-green candle. High volume on this candle as the small trading range is broken to the upside.
This action is happening right below 0.618 Fib., notice that 0.786 ($17) was never touched, this is bullish.
The short-term barrier to break is 0.618 Fib. retracement and EMA10. Closing above these levels work as bullish confirmation and likely the resumption of the bullish trend.
I say likely because things can change, invalidation can happen if the 1-Sept. low is broken at 19.
The correction has been going for more almost two months now and it all seems quite bullish. We have the classic 1,2,3,4,5 bullish impulse and the ABC, this is followed by another impulse...
The waiting is likely over... Do you agree?
Namaste.

Solana preparing for a bulish breakout?For almost one year, SOL has been trading in the range between $9 and $27 (current price $29). Both RAI and MACD are slightly in an oversold area (1-day candles).
The developer activity on Solana has had a substantial drop since Mar. 2022., going from 70 000 commits to 16 000 commits in Sept. 2023.
However, this year, it has shown some recovery. From Jan to Sept, the developer activity increased by 50%.
Price Sept. 2023: $19. YoY growth: 72%
Solana TVL Sept. 2023: $300 million YTD growth: 75%
Solana TVL/Mcap: 0.0375

SOL/USDT - Potential Trend Continuation to BearishThis pair has formed a bearish rising wedge continuation pattern. Altought, there was a divergence, but it seems to be diluted as of now. This suggests it will follow the the downward swing.

FTX starting to liquidate ?Would not be surprised to see a flash crash on the SOL and Ftx involved ecosystem.
Rsi Losing below mid section.
A sharp mind once said you will be happy if you bought SOL below $10.

SOLUSD - Bearish Trend ReversalThe pair was in a good bearish rally. But, it has a bullish divergence of now. The current reversal pattern seems to be a double bottom. According to AB=CD Harmonics, the potential reversal zone (PRZ) will also play here. The entry, stoploss, and profit levels are marked. Let's see how the trade goes!

SOLANA: Hold here or hello 17s Solana is trading on support at the bottom of the box. Lose it and is a freeway to high 17s. If it holds we can see a rally to test 22 again. No trading zone here.

Solana BullishTechnical analysis plays a pivotal role in deciphering market trends, and in the case of Solana, it provides valuable insights into the ongoing bullish momentum of this cryptocurrency. Let's delve into the key technical factors contributing to Solana's upward trajectory.
Price Trend and Moving Averages: Examining Solana's price trend through moving averages offers a clear picture of its bullish sentiment. The interaction between short-term (e.g., 50-day) and long-term (e.g., 200-day) moving averages provides clues about the strength and sustainability of the trend. If the short-term moving average consistently remains above the long-term moving average, it signals an established bullish trend.
Relative Strength Index (RSI): RSI is a momentum oscillator that measures the speed and change of price movements. A reading above 70 typically suggests an overbought condition, potentially indicating a short-term pullback. Conversely, an RSI below 30 indicates an oversold condition, potentially hinting at a rebound. In the context of Solana's bullish technical analysis, an RSI consistently hovering in the upper range could signify strong buying interest and sustained upward momentum.
Volume Analysis: Analyzing trading volume alongside price movements can provide insights into the strength of a trend. During a bullish period, increasing trading volume as prices rise validates the trend's legitimacy. It indicates that more participants are entering the market, further fueling the price rise. Decreasing volume during minor pullbacks is often considered a positive sign, as it suggests that selling pressure is limited.
Chart Patterns: Bullish chart patterns, such as the "cup and handle," "ascending triangle," or "bull flag," can indicate potential continuation of an upward trend. These patterns are formed through a series of price movements and consolidation phases, suggesting that the market is preparing for another leg up. Identifying such patterns through technical analysis can provide traders and investors with entry and exit points.
Fibonacci Retracement Levels: Fibonacci retracement levels are used to identify potential support and resistance levels during price corrections. In a bullish market, the price often retraces to one of these levels (e.g., 38.2%, 50%, 61.8%) before resuming its upward trajectory. If Solana's price consistently bounces off these retracement levels, it reinforces the bullish outlook.
MACD (Moving Average Convergence Divergence): MACD is a trend-following momentum indicator that shows the relationship between two moving averages of a security’s price. A bullish crossover between the MACD line and the signal line can indicate a strengthening bullish trend. Divergence between the MACD and price movement can also provide insights into potential trend reversals or continuations.
In summary, Solana's bullish technical analysis combines multiple indicators to highlight its current upward momentum. From moving averages and RSI to volume analysis and chart patterns, these tools collectively paint a positive picture for the cryptocurrency's price trajectory. However, it's important to remember that while technical analysis provides valuable insights, market dynamics can change rapidly, and combining technical analysis with fundamental research is often a prudent approach for making well-informed investment decisions.

Will Sellers Plunge SOL Price To $15?SOL price showcases a falling channel pattern on its daily chart.
Solana experiences a 4.45% dip, erasing recent gains from positive market sentiment.
A looming death cross between the 50 and 200-day EMA indicates bearish momentum.
Solana boasts a 112% YTD growth, hinting at its resilience.
The SOL price is currently hovering around $20, with a potential bullish wave forming at the support trendline.
Despite a recent drop, SOL finds support at the 38.20% Fibonacci level.
MACD suggests a bullish crossover, while RSI indicates a potential recovery.
If SOL sustains above $20, it could target resistances at $23 and possibly $28.
A slide below $20 could trigger a deeper correction, with a potential target at $18.45.

[C-004] SolanaTrading idea number C-004 | Solana could raise to 26,500 USD area.
The RSI and MACD are positive and below its signal line. Therefore, the price may still retrace. In addition, the price is trading below the 20-period moving average but above the 50-period moving average, which should act as short-term support.
📈 Long Entry at 21.58
💰 Take Profit at 22.6
💸 Stop Loss at 21.10

SOL to the 27-28USDcIn the current scenario, where SOL/USDT (Solana against USDT) is forming a "bull flag" pattern, there has been observed a positive price movement that suggests a potential increase to the range between 27 and 28 dollars per SOL. The bull flag pattern is typically seen as a continuation pattern within the existing trend, which in this case could be an ongoing upward movement in Solana's price.
It is anticipated that the breakout from this bull flag pattern could lead to testing resistances at higher levels. This way, SOL could move towards the target range of 27 to 28 dollars per SOL. It's crucial to monitor whether this upward trend is supported by sufficient trading volume and investor interest.
In the event that the ascending trendline is breached, and SOL/USDT falls below this level, there is a risk of another downward move. This could result in disrupting the current upward trend and initiating another corrective phase downward. Therefore, it's important to keep an eye on price levels, trading volume, and technical indicators that might indicate the strength or weakness of the market movement.

✴️ Hit The Gas! Solana Going Above $50These two lines, very simple indeed; two lines, people call them a "flag".
If the lines converge at the end people call them a "pennant", these two are what we call "bullish continuation patterns", boom!
The bullish bias has been confirmed but I can't honestly say that I am surprised... What I can honestly say is, finally!
With the bulls confirmed a new high should come within weeks.
Easy, Solana can move above $50.
I have many trade ideas describing all the signals & more...
This is just a friendly reminder, feel free to hit the gas!
Everything set to grow!
Namaste.

Hold here to restartSolana's current trading pattern is characterized by sideways movement within the range of 19.7 to 20.4. The next significant price shift hinges on a breakout or breakdown from this range. In my analysis, there is a favorable inclination towards an upward movement. It's worth noting that a breach of the 19.7 mark followed by a test of 21.6 appears to be the most probable outcome at this juncture.

Aug.22-Aug.28SOL(1d)Weekly market recapPowell spoke at the Jackson Hole conference last week. There were no extra hawkish or dovish surprises in the content. He repeated the Fed's determination to reduce inflation and that monetary policy will depend on economic data. During the course of the presentation, financial assets fluctuated, but did not trend.
On this Friday, the US will release employment data for August, and if the actual value do not deviate significantly from the expected value, there will be little affect on financial assets. Although the DXY has hit other financial assets in the past few weeks, it is certain that the Fed's interest rate hike is gradually coming to an end. Be patient and have a good attitude.
After our recap was published last week, SOL continued to fell with fluctuation, and the price was close to 20. During this process, the trading volume is invalidated. While the pace of decline has slowed, the bulls have not strengthened. You can find that there were not many green candles last week, the subsequent candles were shorter, and the high point of the rebound gradually decreased. This is a manifestation of the lack of strength of the bulls.
Conclusion: Mostly falling. SOL remains neutral on a large scale. But bears are weaker than bulls. So we come to this conclusion. We maintain the previous resistance level at 26 and support level at 19.
Disclaimer: Nothing in the script constitutes investment advice. The script objectively expounded the market situation and should not be construed as an offer to sell or an invitation to buy any cryptocurrencies.
Any decisions made based on the information contained in the script are your sole responsibility. Any investments made or to be made shall be with your independent analyses based on your financial situation and objectives.

Air-SOLSOl is down under the ground.
Air hit Sol.
We are in the consolidation.
Next, it will be continuation of down.
........

100% of the current price up?The decline has not ended yet, and it is rising again to correct the B wave, including the drop in the C wave, to end three large corrective waves
