SOLUSDT.PS trade ideas

Bearish Lower Trends for SOLUSDTGood day,
The price is trending bearish for SOLUSDT in the 30-minute time frame and from the 3-hour time frame to the daily.
The price is hovering bullish above the 181.57 mark but is being pushed bearish by the 3-hourly candle, so there needs to be clarity there.
Overall, the trend is bearish towards 164.65 with a bias towards 157.34.
Happy Trading,
K.

Solana longA correction to major bullish trend stopped around Fibonacci 0.5 level. A continuation of ascending trend to 1 Fibonacci level is expected to happen.

SOLUSDTSOLUSDT is trading in strong bullish trend and consistently printing HH HLs. and is about complete ABCD pattern at strong daily support level. Recently the price is broken the important support zone and now retesting the broken level, which is also the 50% Fib retracement level.
If the buy momentum continues the next target could be 1.0770
What you guys think of this idea?

Cryptolean Solana SOL Update In the daily chart, Solana found a support at $167.
A daily candle closure above $186 will push Solana price towards the key Cryptolean resistance zone of $202-$209 and, possibly, higher.
An inability to sustain the price action above $167 will result in price declining towards $144-$151 the key daily support.
Intraday Chart
The intraday chart of #SOLUSDT is neutral.
A bullish rejection of $168 will push #Solana price towards $194, however to become bullish again, SOL has to break it to the upside and sustain price action above this level.
An inability to hold price above $168 could result in a bearish move to $154 support and, possibly, lower to $126-$138.

SOL long term crystal ball musingsMapping potential targets for SOL if it is to perform similar to BTC in a post halving bullrun.
Note, these are based on fib extensions... i.e. past patterns that may play out again in the coming post halving run.

SOL/USDT bullish reversal from key support? 🚀SOL Analysis💎 Paradisers, keep your eyes on #SOLUSDT! It's approaching a critical support at $150.84. With momentum on our side and a successful closure of a green candle above this mark, we anticipate a bullish journey towards the $210.48 resistance.
💎 Should #SOLANA dip below $150.84, fear not—we have a contingency at $127.14. Imagine this level as a springboard, primed to catapult prices upward once again.
💎 A cautionary note: breaching this secondary line of defense could signal a continued downward trend as selling pressure mounts. Being alert and prepared to pivot is crucial as we navigate the unfolding scenario with #SOL.

SOL (Y24.P1.Video2). Looking for the levels to longHi traders,
Here are my thoughts on SOL and how we will approach the trade and why we took profits and a short.
All the best,
S.SAri

This SOL Chart Makes Me Want to Cry. Black Swan EventZoom out. Pull macro fib time. Pull a monthly supply at ATH. Pull a measured move from ATH to bear market low. Measure from current high. Look at the beginning of a Wyckoff Distribution Schematic. Cry myself to sleep. In that order
We're going into a bear market until April 14th, 2025

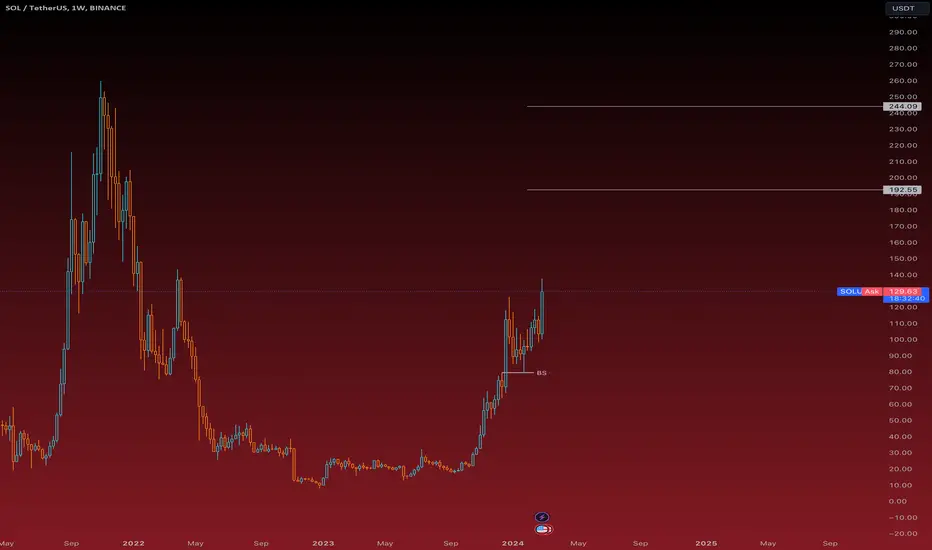
Where does it go?(SOLUSDT W)BINANCE:SOLUSDT The expected target is visible on the chart. If a second target is provided, it is likely to be achieved.
When will bullish trend of Solana end ?(Price and time analysis)Hello everyone, I hope you're all doing well.
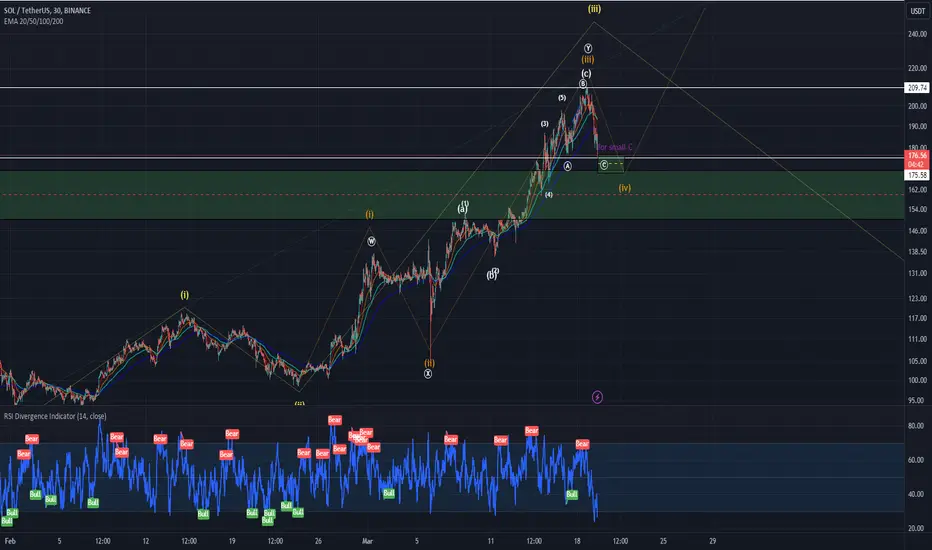
It seems that SOL has completed five waves and is now likely to undergo a corrective wave of three. Negative divergence between waves 4 and 5 in RSI or MACD is often a sign of the end of wave 5.
Keep in mind that both FVGs have filled out the weekly important points.
I don't recommend taking positions, but if you intend to, remember to manage your capital and risk properly without forgetting about rewards.
(Because Solana is very Savage.)
Time analysis:
In the Solana dominance chart, two days are significant:
- Today, which we witnessed the decline, and the next day, Thursday, March 28th, where there's a possibility of significant media news within this time frame, such as the sale of assets by the FTX exchange.
- The last day is April 13th.
In summary, be cautious with your positions over these 25 days.
P.S : The SOL.D chart is for yesterday.
I suggest you thoroughly read the analyses linked below:
USDT.D
BTC.D
BTCUSDT
I'd be happy to share your opinion with me. Your likes, follows, and comments give me energy.
The RSI indicator also suggests a complete cycle.
After starting from a small uptrend channel, it's currently completing an Elliott Wave cycle.
....

Rallying Regardless of Bitcoin's DipSOL is demonstrating remarkable resilience in the current market, consistently trending upwards despite Bitcoin's recent volatility. The latest hour shows SOL trading at $202, marking a solid upward movement with an impressive last day change of over 11%.
The technicals paint a bullish picture with both MACD and RSI indicating strong momentum. The MACD histogram is positive, and the MACD line is above the signal line, suggesting continued bullish momentum. The RSI is not yet in the overbought territory, indicating there may still be room for upward price movement before encountering the typical reversal zone.
We should take note of the upper Bollinger Band, which SOL is currently testing. This is often seen as a potential resistance area. If SOL can break through this, we might see continued upward movement, but a rejection could lead to a short-term pullback as indicated on the chart.
Volume remains robust, reinforcing the strength of the current price trend. The 1-hour chart showcases SOL’s potential to establish new support levels if the rally sustains. We should monitor for any signs of a breakthrough or rejection at the upper Bollinger Band and the static resistance level for potential entries or exits.
This solid performance of SOL/USDT, especially its decoupling from Bitcoin's downtrend, underlines the unique market dynamics that individual cryptocurrencies can exhibit. While Bitcoin often influences the broader market, SOL's current trajectory showcases how strong fundamentals or project-specific news can drive independent price action.
Enjoyed the analysis? Don’t forget to hit like, drop a comment with your thoughts, and share it with your friends.

How quickly will Solana reach ATH?I think it'll be quick enough. Solana's cheap and fast, and it still works. Let's do it! Solana new ATH coming soon.

SOL Weekly Price ActionLast week, Solana (SOL) saw a surge in popularity, with both SOL and its ecosystem, including meme tokens, delivering impressive returns to investors. SOL rose by 18.56% to reach $209.4, approaching its ambitious all-time high of $259.6. However, it is currently experiencing profit-taking and an overall market correction, finding support around the $168 range, where significant order block levels are observed.
Currently, SOL is showing signs of a rebound, with its price trading around the $178 mark. Maintaining this level could indicate further upward momentum for SOL, depending on overall market conditions. Both oscillators and moving averages suggest a strong buying sentiment for SOL across all time frames.

SOL updateThe SOL in tf 1 hr or less technically price already come down to the target of 175-178 (but still looking for the lower
be careful of another bullish trend
still going up somehow
SOLUSDT. Intraday tradeIf the price returns to 197.95 now and if the seller defends this level, then we can look for a short with a target of 178.55."

SOL Solana Trade IdeaSOL Solana is clearly trending bullish as we can see on the 4 hour time frame with consecutive higher highs and higher lows. We look for an entry on the Fibonacci retrace down into the 50 to the 61.8% level. We can see support on a previous high to the left of the current price swing which could provide support for an entry point. Target one is the current price swing high take partial profits and move stop loss to break even, target two would be a measured move above the current price swing. This analysis is for educational purposes only and not financial advice. Always trade with a solid risk management plan.

SOL going parabolic: Where to take some profitsThe price of SOL has been going parabolic and the momentum is very strong atm! If you're looking to trade SOL at the moment, here's a quick setup that you might find helpful!
The idea is: Buy when the price breaks above 205$ and take profits at the levels shown in the chart.
Targets:
1. 215$
2. 235$
3. 258$
-------------------------------------------
About our trades:
Our success rate is notably high, with 10 out of 11 posted trade setups achieving at least their first target upon a breakout price breach (The most on TW!). Our TradingView page serves as a testament to this claim, and we invite you to verify it!
-------------------------------------------
Recent Altcoin Trades:
FLOKI: 29% profit!
SHIB: 35% profit!
SOL: 38% profit and still going!
-------------------------------------------
Active Trades:
FLOKI / USDT:
XRP / USDT:

SOL WHAT WE ARE WAITING ?!Hello Traders and everyone, I am Hadi Karaali, Known as SNIPERS_FX
If you like the idea, do not forget to support with a like and follow.
SOL WHAT WE ARE WAITING ?!📚
👉As we can see price is still overall bullish from a long-term perspective, trading inside this rising broadening wedge
👉Moreover, price approached a massive resistance zone, lining up with our upper bound of the rising broadening wedge acting as an over-bought zone, where we will be interested in looking for new shorts.
👉Meanwhile, from a short-term perspective, price is still trading inside this rising channel, and as per my trading plan, I will be waiting for a new swing low to be formed then a break as shown on the chart.
Meanwhile, and until that happens, price is still bullish and can still trade higher. 📚
If you like this kind of analysis don't forget to like and follow
and as usual follow your trading plan and manage your risk.
Be patient and good luck!

sol short hello Traders, here is the full analysis for this pair, let me know in the comment section below if you have any questions, the entry will be taken only if all rules of the strategies will be satisfied. I suggest you keep this pair on your watchlist and see if the rules of your strategy are satisfied. Please also refer to the Important Risk Notice linked below.

SOL huge breakout is possible !SOL / USDT
Solana is breaking out in weekly chart
As long as it save the key level it Looks very bullish incoming days

SOLUSDT.1DIn this SOL/USDT daily chart, the recent price action has taken Solana above the Ichimoku Cloud, a bullish sign. There’s a marked upward trend with resistance (R1) at a higher price point indicating a potential future target.
Ichimoku Cloud: Being above the cloud is bullish, suggesting that the uptrend may continue. The cloud will now act as support.
Moving Averages (Ichimoku Lines): The conversion line (blue) is above the baseline (red), which further supports the bullish sentiment.
Resistance (R1): There's a resistance line drawn above the current price, signaling a level that could potentially halt or reverse the upward trend.
RSI: The RSI is high, hovering just under overbought conditions. This could indicate that the price might see some consolidation or pullback soon.
MACD: The MACD is positive and above the signal line, which is typically a bullish signal. However, the histogram is showing signs of decreasing momentum, so it's crucial to watch for any potential crossover that could signal a reversal.
Considering these indicators, the momentum for SOL appears bullish, but the high RSI suggests caution, as there could be a pullback. If you're trading, it might be wise to look for confirmation of continued bullish momentum before entering a position and setting a stop-loss to manage potential downside. The resistance level could be seen as a target for taking profits should the price continue to rise. It's essential to consider the broader market sentiment and news that can impact price movements.

SasanSeifi 💁♂SOL/4DAY Long-Term 🧐 Hey there,✌
Solana's price oscillated between $10 and $27 for an extended period. After breaking the long-term downtrend line, the demand for SOL increased, resulting in an upward trend for approximately 6 months. the price has ranged and accumulated volume around $100 before surging to $207.
Current Movement: The price is heading towards its previous all-time high (ATH) of $259.
Scenarios:
1. If the momentum weakens around $250 and is confirmed, the price may experience a correction. After a pullback, we can expect further growth in the long term.
2. If the price faces demand and breaks above the previous ATH, the first target would be the $350 price range.
The chart above illustrates the possible trends and long-term targets for Solana.
Long-Term Support Levels:
$130
$100
(The chart is logarithmic.)
Remember, this is just a technical analysis and not financial advice. Always do your research before making any investment decisions.❗❌
I hope this analysis was helpful! If you have any questions, feel free to ask.✌
