Possible short trade setup for SOL/USDT.P 4H TFAs we can see a bearish OB highlighted in the chart, we have a high chance of reversal from that point. Moreover, we have a FVG in 15min TF in that area that has not been visited yet.
So here's my trade plan.
SOLUSDT.PS trade ideas

Solana Drop to 80 looks imminentA few weeks ago, I mentioned the possibility of BINANCE:SOLUSDT retracing to the 80 zone support level once more.
However, Solana surged upward and triggering my stop loss in the process.
Despite this turn of events, my perspective on the market remains unchanged, and I still anticipate a return to the 80 level.
From a technical standpoint, the recent up move from 80 appears to be corrective rather than impulsive, with 120 emerging as a formidable resistance barrier.
Confirmation of a potential downturn would materialize if the price dips back below 100 once more.
I'm looking to sell again.

SOL/USDT LONG Signal - Potential for Upward Movement!Our analysis indicates a robust buying position for SOL/USDT. We use a 2x Leverage for this trade.
Trading Signal
Primary Entry : 110.85 USDT (Limit Order)
Secondary Entry (DCA) : 106.3 USDT
Stop Loss : 103.1 USDT to minimize risk
Profit Targets
Target 1 : 112.7 USDT, then move SL to entry point
Target 2 : 114.8 USDT
Target 3 : 121.9 USDT
Target 4 : 134.4 USDT
Helpful Tips
Save Money: Use limit orders instead of market orders for lower fees.
Stick To Your Plan: This is key for making progressive gains!
Control Your Risk: Your stop-loss order protects you against unforseen market reversals.
We aim to provide high-quality signals that guide you to success. Happy trading!

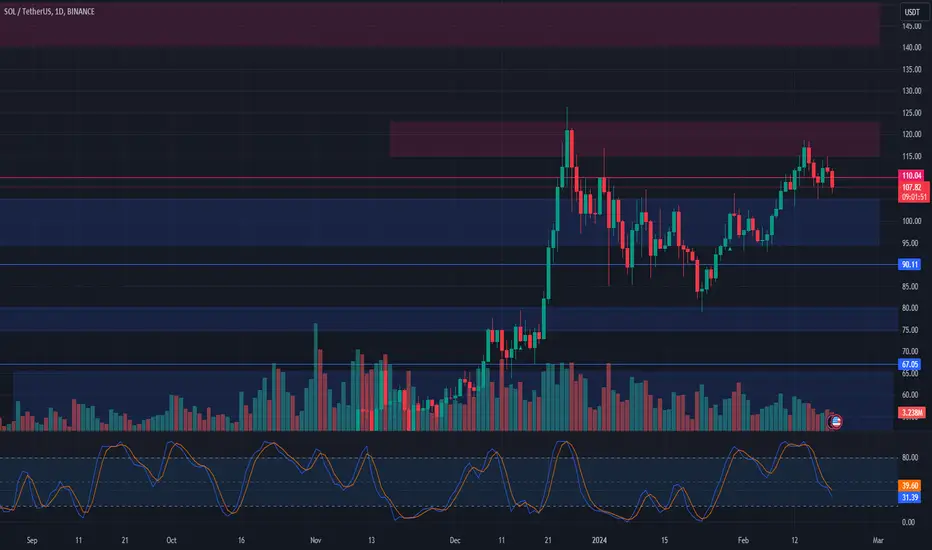
I see a negative scenario for SOLANA, will we drop below $100?Hello everyone!
I want to warn those who have open LONG positions on #SOLANA. In the local perspective, we can expect a decrease in the asset down to $92.5 as a head and shoulders pattern has formed on the 1-hour and 4-hour timeframes.
The situation is also negative on the daily and weekly timeframes. Since the last local price high on February 14th, I have been seeing selling pressure. The week also started negatively.
However, the drop may not be as deep, as we have support in the form of the 200-EMA and the strong Fibonacci 0.236 level, which is at the round number of $100.
Therefore, I believe it would be wise for those trading with leverage to reduce their positions, and for those with extra funds to place buy orders at the following levels:
$100
$96
$92.5
In the global perspective, after this correction, I expect growth towards $150.
This is not financial advice, everything you do, you do at your own risk!

SOLUSDTmy entry on this trade idea is taken from a point of interest BELOW an inducement.. I extended my stoploss area to cover for the whole swing as price can target the liquidity there before going as i anticipate.. just a trade idea, not financial advise

Bybit SOLUSDT.P Short PositionI'm considering taking this short trade based on a very simple idea of the volume moving in correlation with the price action. What I see is a very large move on the downside followed by a weak pullback. I will place a short trade if the price closes red on the next hourly candlestick and the volume bar closes higher than the previous. Lets see what happens!
SollUsdtprojection of short position on a daily tf
projection of short position on a 4h tf
www.tradingview.com


SOL Plan 0.09Forecast the SOL graph using Elliott Wave theory. This graph has an a-b-c subwave structure, indicating a strong B, flat correction. Currently, wave B has completed, and the graph is transitioning from wave B to wave C.
Wave C can be either motive or impulse. At this stage, look for opportunities to trade short in the sub-waves of Wave C until Wave C is completed.

$SOL #Solana Trading IdeaSOL Solana was a good asset for people to start swinging for a short-term (mid-day trading). Right now Solana is inside this Descending Channel on a 4H timeframe, still forming higher lows (HL) and there is a probability for us to see a breakout through this channel and see another leg up on SOL/USDT. BUT... Maybe now it's the time for SOL & other ATLS to get that pullback? Give me your thoughts on this Trading Idea and on the previous 5th trendlines that you could've been trading almost successfully.

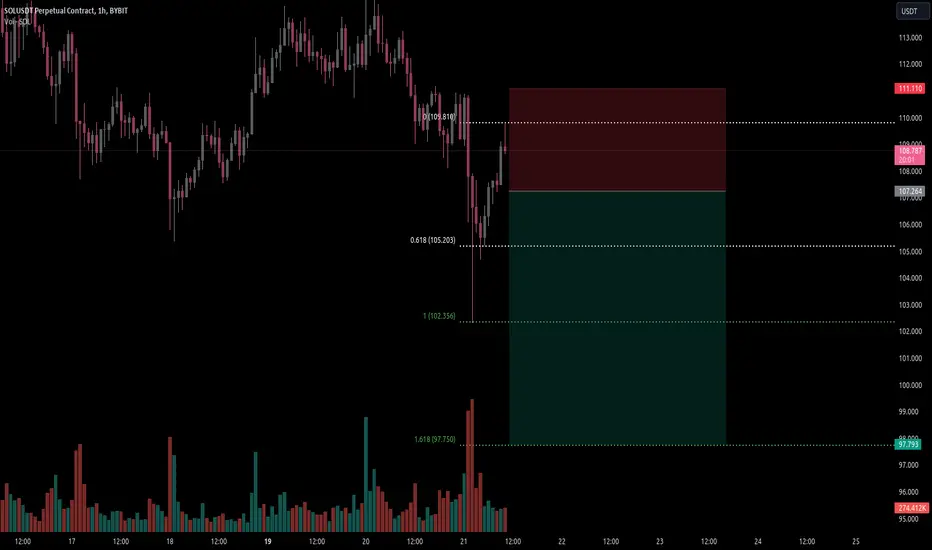
SOL Analysis - Anticipating Correction and Long Position Plan!📈 Price Movement:
Rejection: SOL was rejected around $120 last week.
Retracement: Since then, it has retraced to the current trading price of around $107.00.
Support Level: The $105.00 level is holding as support.
💼 Trading Plan:
Potential Correction: Anticipating further market correction in the next week, possibly testing the bottom range level of support at around $94.50.
Long Position: If the price retraces to $94.50, considering a long position.
Profit-Taking: Plan to take profit in the $140 – $150 resistance area.
Risk Management: Set a stop-loss just below $90.00 to manage potential losses.
🔄🔍 Note: Keep an eye on market developments and adjust the plan accordingly. 🚀💡
#SOL #CryptoTrading #PriceAnalysis 📊📌
Solana LONG SET UP!Good morning happy Tuesday!
I am sharing with you all my set up.
I am going long i saw the weekly market cipher b ready to start long to the upside with the vwap and money flow coming to the upside.
2 the daily seems to be retesting the zero line at vwap, 30 minute seems to be doing the same with the 8 hours looking extremely bullish.
I spotted my entry on the 24 minute right around 108.23


Solana Triple top formationCRYPTOCAP:SOL Forming Triple Top, this triple top is the bearish formation this can take down the price of #sol to 99-102$.

✴️ Solana | Fib. Based Resistance; & SupportRESISTANCE
Why is Solana having such a hard time moving and closing above $113?
Solana's highest weekly close related to its 2023 bullish wave happened the 18-Dec. week at $112.50.
The highest price hit was $125.35 the following week on wick, 25-Dec.
This same week closed at $101.70
Last week, 12-Feb., Solana wicked to $118.69 and closed at $112.24.
Notice the close is the same as the 28-Dec. session. Never a close above $113.
Using multiple points of reference to plot the primary Fibonacci resistance numbers for the entire 2023 bullish, we can see that three out of four variations yield numbers showing resistance at $113, $114 and $119. One final and major resistance level came out as $133.
So the price range between $113 and $133 represents very strong resistance and this is confirmed by the fact that SOLUSDT has not been able to move higher in almost two months.
With trading volume dropping for more than a year, this takes us to...
SUPPORT
Short-term we have $88 as a relevant resistance level but this price already hit twice in January.
If SOLUSDT remains within a lower high the next drop will push prices much lower.
A range that really stands out and should be consider the main support on a drop is set between $57-$63. This range is matched by multiple fib. levels and EMA50.
The next support range is one to which people reacted strong the first time that I mentioned it, so probably the right one. We are seeing $32-$35 as a very strong support. If/when the next correction develops, if there is no new highs compared to 28-Dec. 2023, we can expect this range to be the correction low.
CONCLUSION
➖ A higher high would take Solana to $155.
➖ A correction would take Solana first to ~$60 and finally $33. This is something people cannot even imagine, impossible to conceive and exactly for this reason most likely what we will soon see.
Up or down?
➖ If it goes up, then it goes down.
➖ If it goes down it continues down for a while and then reverses and goes up.
Namaste.


SOL Answer KeyI think FTX stock market speculation works to scare investors. Very positive for technical uptrend

SolusdtWe anticipate BTC to potentially reach the $23,700 level before a potential upward rally. If the support at $23,700 holds, there is a possibility of a 50% price increase from the Neck Line support, with a target of $36,000.

Trade idea in Solana Be ready to dive in the world of Charts. Currently we have solana COINBASE:SOLUSD

A Bullish Outlook Emerges For SOL Amidst Market FluctuationsThe Solana price has recently displayed signs that have caught the attention of many investors and traders. Analyzing the closing prices alongside key technical indicators reveals a narrative that leans towards a bullish sentiment, suggesting potential upward movements in the near term.
The closing prices for the Solana price on the 4-hour chart have shown a pattern of resilience and slight volatility. While demonstrating minor fluctuations, SOL’s latest prices underline a market that is cautiously optimistic, with each dip being met with a recovery that hints at underlying buying interest.
Technicals Hint at a Continued Bullish Move
A deeper dive into the exponential moving averages (EMAs) strengthens the bullish case. The 9-day EMA has seen a consistent rise from 110.272 to 111.436, remaining beneath the closing prices and indicating a bullish momentum. This trend is echoed by the 20-day EMA, which has gradually increased from 110.666 to 111.192. The alignment of both EMAs below the recent closing prices serves as a classic bullish signal, suggesting that the market sentiment is leaning towards optimism.
The Moving Average Convergence Divergence (MACD) further accentuates this bullish sentiment. Transitioning from negative to positive, the MACD values have moved from -0.398 to 0.129, with the histogram values becoming increasingly positive. This transition not only signifies growing bullish momentum but also indicates that the market is gaining strength, as evidenced by the MACD crossing above its signal line.
The Relative Strength Index (RSI) offers a complementary perspective, positioning itself in a neutral to slightly bullish range between 52.478 and 56.467. This suggests that while there is a clear buying interest, the market is not overextended, thereby providing room for potential growth without the immediate risk of a pullback due to overbuying.
Volume analysis, although showing fluctuations, indicates active market participation. The recent decrease in volume may suggest a period of consolidation, often seen as a precursor to a significant move, provided the market sentiment remains positive.
The technical analysis is further supported by the immediate resistance and support levels that the Solana price faces. The resistance levels at $112.78, $114.14, and $114.47 are the thresholds that need to be breached to confirm the bullish momentum. The support levels at $111.75, $108.65, and $107.2, meanwhile, offer strong foundations that not only prevent significant downturns but also present buying opportunities on dips.

SOL - If I get the chance!If SOL pulls back into the 200MA on the 4H then I will take a long position. Bids set at 106. lets see if we're lucky enough to get it.

SOL/USDT - Jumping from the Bowl - SOL had a nice cup patter and showing overall bullish sentiment.
- If SOL manages to break its Previous Resistance level then its an easy run for SOL to reach new highs
- Currently price is around the support zone and this consolidation is expected to continue for couple of days
- Once this consolidation is over we can expect the price to bounce up, if the price breaks the support zone then we are looking at bearish trend for SOL.
- lets hope SOL breaks its resistance level and reaches new Highs.
Regards
VectorAlgo

Solana token in 3 hours time frameSolana token in 3 hours time frame
As you can see in the jar, the head and shoulders pattern is forming.
Considering the status of the RSI indicator and the distance from the 200-day moving average, we can hope for a short position.
This is not a buy or sell offer.
Check according to your technical analysis knowledge
Good luck and profitable.
