S&P500 Index (US500): Bullish Accumulation Pattern
I spotted a nice example of an ascending triangle pattern on a daily time frame.
To confirm a bullish continuation, we will need a bullish breakout
of its neckline.
A daily candle close above 5996 will provide a reliable confirmation.
A rise will be anticipated at least to 6080 resistance then.
❤️Please, support my work with like, thank you!❤️
I am part of Trade Nation's Influencer program and receive a monthly fee for using their TradingView charts in my analysis.
SPIUSD trade ideas

Skeptic | SPX 500 Analysis: Long Triggers Ready to Rip!Hey, what’s good? It’s Skeptic! 😎 Last week, we scored a nice R/R on SPX 500, and now it’s looking ready for another big move, super close to our long trigger. Let’s check it out with a multi-timeframe breakdown to grab those long and short triggers!
Daily Timeframe: The Big View
The SPX was riding a strong bullish wave, then hit a deep correction. Here’s what’s up:
It’s bounced back most of that drop and is nearing its ceiling at 6128.55. 🏔️
A break and hold above 6128.55 could kick the bullish trend into high gear, per Dow Theory.
Watch the daily RSI—if it goes overbought, we might see a fast, big rally. 🚀
This is our long-term play, so let’s zoom in for the short-term action!
4-Hour Timeframe: Long & Short Triggers
On the 4-hour chart, here’s the plan for our trades:
Long Trigger: Break above 5990.67, with RSI above 66.57 to show the move’s got juice.
Stop Loss: Your choice—put it below 5955.77, or check 1H or 15-minute charts for a tighter stop under the last low. 🎯
Short Trigger: A drop below 5856.93 lets you short, but it’s against the trend, so keep it low-risk. Take profits quick, use a small stop loss, and close when you hit a good R/R. ⚠️
Shorts are tricky here, so play it safe and don’t go all-in!
RSI Trick & Your Input
Love RSI? I’ve been using it forever, and I think most guides get it wrong. They say overbought RSI means sell, but for me, it’s a go sign for longs! Want a full RSI tutorial? Tell me in the comments, and I’ll hook you up! 📢
💬 Let’s Talk!
If this got you hyped, hit that boost—it helps a ton! 😊 Got another pair or setup you want me to hit? Drop it in the comments. Thanks for chilling with me—keep trading smart! ✌️

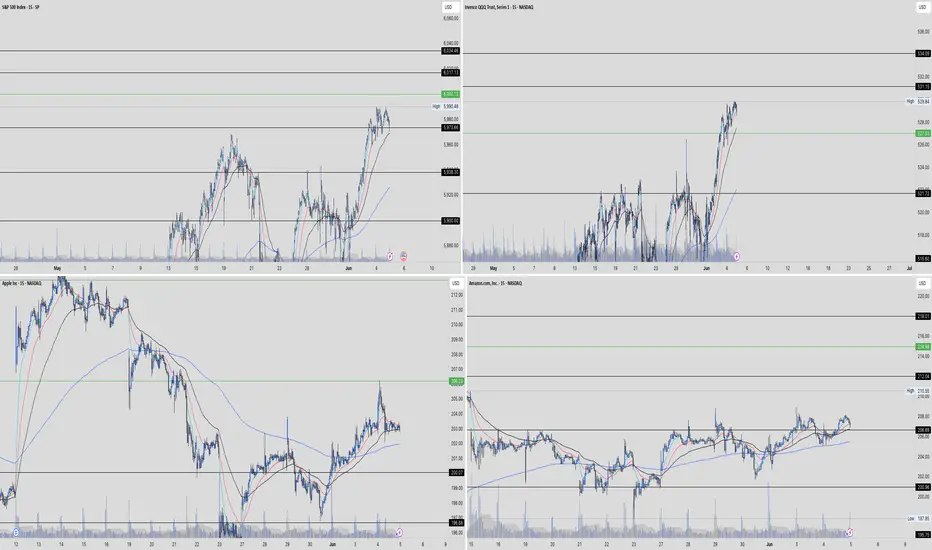
Andycharts, publishing key levels. We have key levels across 15 different charts which I am looking at tomoorow for contination,
SPX500 — Structural Weakness Emerging on the 15-Min ChartWe may be approaching a critical inflection point.
Price action is showing signs of exhaustion after multiple failed attempts to break higher. The market structure is compressing beneath resistance, setting the stage for a potential breakdown.
🧭 Key Level to Watch:
Support at 5,790.33 aligns with previous liquidity sweeps and demand zones. A move toward this level could reflect rotation from short-term bullish euphoria into a broader correction cycle.
⚠️ Institutional traders, are you watching the same tape?
This isn’t just about price—it’s about positioning.
Market signals:
Distribution pattern forming
Liquidity void below current level
Compression likely to result in expansion (downside bias)
In markets like these, timing is everything.
Capital flows speak louder than sentiment.
#SP500 #MarketStructure #InstitutionalTrading #TechnicalAnalysis #SmartMoney #LiquidityZones #MacroStrategy #WaverVanir #RiskManagement

All-Time Highs (3% Up) or US/China Trade Gap (4-5% Down)?It's summer time (1st week of June)
Brutally slow price action thus far, Non-Farm Payroll hits this Friday
Next week will be more US Inflation Date (CPI, PPI)
S&P and Nasdaq are only 3% (or slightly less) away from all-time highs
Melt-up momentum says it's the path of least resistance
US/China Trade Agreement Gap (that silly little Monday announcement) is 4-5% lower
Whatever we hit, there will be disappointed traders and investors - the ultimate pain trade :)
I'm not bearish, I'm ridiculously cautious as a bull and wanting to see a pullback. I can tell
because it's actually annoying watching the market grind so slow to the upside shrugging
off every bad news bite and sense of reality
The big beautiful tax bill is losing support (see Elon Musk's latest comments)
The Trump Administration has pivoted so hard the other way the market is virtually
ignoring tariff news now
Let price be your guide. I'm connecting the April 7 lows forward and if the bears cross it and price sweeps some lows, there might be some pullback potential in the cards
Plenty to watch - be patient - opportunities await. Not forcing anything for now and I'm
doing the "boring" stuff for income trading.
Thanks for watching!!!

The close - no bells ring at a topMy feeling right now is one of deja vu. Like the bottom before the president delayed tariffs, there was no volume and my assumption was we would go a bit lower. Here we have no volume and my assumption has been we will go a bit higher. Could we top here? It's possible. The bear divergences are pointing to a move down at least temporarily.

S&P500: Gearing up for a push to 6,100S&P500 is bullish on its 1D technical outlook (RSI = 64.611, MACD = 85.830, ADX = 19.630) as it has been trading inside a Channel Up for over a month. Right now it is halfway through the new bullish wave. We expect it to rise by at least +4.40%, same as the previous one. Stay bullish as long as the 4H MA50 holds, TP = 6,100.
## If you like our free content follow our profile to get more daily ideas. ##
## Comments and likes are greatly appreciated. ##

SP500 would you capture or just let it slip?His palms are sweaty
Knees weak, arms spaghetti
His nervous
But on the surface
He looks calm and ready

Acorn's Smart Money S&P SignalJune 3, 2025 - After another successful S&P signal in May, we have another Bullish signal for the first part of June. If correct, the bullish S&P indicator suggests the S&P will close above 5861.43 on June 19.

S&P 500 is Under Pressure from Weak ADP Data, Strong ResistanceThe S&P 500 is showing signs of contraction just below the key 6000 level. The ADP employment report, which revealed the slowest pace of hiring since March 2023, has raised some concern among investors. Whether this weak labor data will significantly impact the broader stock market remains to be seen.
Tariff effects appear to be gradually surfacing, first in jobless claims, then in the ISM manufacturing data, and now in the ADP report. Inflation data will likely be affected last, probably in a few months, due to the fact that both households and businesses frontloaded purchases ahead of the tariffs. As a result, the market could first confront recession fears, followed later by concerns about stagflation.
From a technical standpoint, a short-term RSI divergence is emerging, and the 6000 level is acting as strong resistance. If the S&P 500 fails to break above this resistance, a selloff could be triggered, with the 200-hour moving average as the initial target. Should the index fall below the 200-hour level, bearish momentum could increase, potentially deepening the correction.
To invalidate this negative scenario, the index would need a clear breakout above 6000, confirmed by multiple daily closes above that level.

Balance could break todaySPX may go higher but it could be a false break according to the RSI. Gold looks like it will go higher. USOIL is retreating from resistance so far. BTC still looks like it will drop.

US500 Bullish Outlook US500 Bullish Outlook
US500 is well-positioned for another upward wave.
The price is forming a bullish triangle pattern, suggesting further gains if it breaks above the pattern or surpasses 5990.
Key upside targets are 6100 and 6240.
Investors are closely watching any new trade deal. If Trump rejects any deal or issues threats, the US500 could temporarily fall to 5930 before resuming its rise.
So far, the overall trend remains bullish, with no signs of reversal as long as key levels hold.
You may find more details in the chart!
Thank you and Good Luck!
❤️PS: Please support with a like or comment if you find this analysis useful for your trading day❤️

S&P 500 is going in a ranging mode5704 is a historical key level, now we are slightly above it; for serious buyers we have to wait until the news; we will watch a retracement in this zone then we can take our position long

SPX Key Levels to Watch Jun 4 In today’s analysis of the S&P 500 (SPX), we’ll break down the crucial levels to watch as we head into June 4th. After perfectly testing the 5929 level yesterday, the market bounced back, setting the stage for potential moves. We’ll discuss the new support range between 5954 and 5967 and what it means for traders. If this range holds, we might see a rally towards 6165, but if it falters, a drop to 5850 could be on the horizon. These levels are highly actionable, so stay sharp and ready to react!

Something Brewing on SPXCup and handle brewing on the SPX daily. All time highs are near. See you there before the pullback

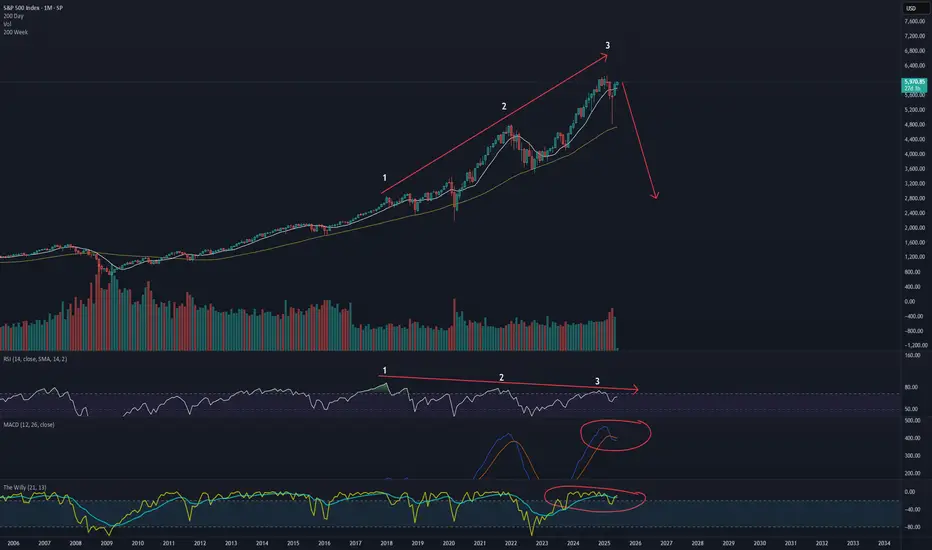
3 drives of bearish monthly divergence = bear market incoming"A bull market is like sex, it feels best just before it ends"
would like to draw attention to the bubble stocks and crypto right now, providing a definitive definition of mania.
The argument for a lost decade is in order.
The first decline in the spx will be aprox 55% to 2800, likely to recover its highs similar to how the market traded in the 1970's