Precious metals bull market starting pointLot's of similar charts aligning. We are right at the decision point. Will it be like "false start" 2016 or summer 2020? Or will it be more like 1976 or 2000??
If it's like 1976 or 2000, that means the bull market for precious metals and precious metals miners, in real terms, is just beginning.
We'll find out soon!
SPIUSD trade ideas

Multinational Corporations (MNCs) & Their Impact on Global TradiHistorical Evolution of MNCs in Global Trade
Early Forms (Pre-19th Century):
Trading companies like the British East India Company and Dutch East India Company (VOC) in the 17th century were precursors of modern MNCs.
These entities controlled trade routes, natural resources, and colonies, combining commercial with quasi-governmental powers.
They were central to early globalization, particularly in spices, textiles, and precious metals.
Industrial Revolution (19th Century):
Rise of steamships, railways, and telegraphs facilitated international business expansion.
Companies like Singer Sewing Machine and Coca-Cola began setting up operations in multiple countries.
Access to new markets and raw materials became driving forces.
20th Century Expansion:
Post-WWII era saw unprecedented growth in MNC activity.
Organizations like the World Bank, IMF, and GATT/WTO created favorable conditions for cross-border trade.
Automotive companies (Ford, Toyota), pharmaceuticals (Pfizer, Novartis), and oil firms grew into global giants.
21st Century Globalization & Digital Age:
MNCs now dominate global trade through sophisticated supply chains and digital platforms.
Technology firms like Amazon, Google, Meta, and Alibaba reshape e-commerce and services.
The scale and influence of MNCs rival those of many nation-states.
MNCs’ Role in Shaping Global Trade
1. Expansion of Global Markets
MNCs increase trade volumes by producing goods in one country and selling them in another. For instance:
Apple designs in the U.S., manufactures in China, and sells globally.
Nestlé sources raw materials from Africa, processes them in Europe, and distributes worldwide.
This multiplies cross-border flows of goods, services, and intellectual property.
2. Creation of Global Supply Chains
MNCs pioneered the idea of fragmented production. A single product may pass through 10–15 countries before reaching consumers.
Example: A smartphone’s chips from Taiwan, software from the U.S., assembly in Vietnam, packaging in China, and final sales in India.
This supply chain structure makes global trade deeply interconnected.
3. Foreign Direct Investment (FDI)
MNCs contribute significantly to global trade through FDI, where they invest in factories, offices, or infrastructure abroad.
FDI increases production capacity and export potential.
Countries like India, Vietnam, and Mexico attract MNCs for low-cost production and skilled labor.
4. Technology Transfer
MNCs carry cutting-edge technologies across borders, fostering industrial upgrades in host nations.
For example, Toyota’s lean manufacturing system spread globally, revolutionizing efficiency.
Tech giants bring digital innovations to developing economies.
5. Employment Generation & Skill Development
MNCs provide millions of jobs in host countries and train local workforces in global standards.
BPOs in India (Infosys, Accenture, IBM) boosted IT-enabled services exports.
Manufacturing hubs in Southeast Asia thrive because of MNC-driven employment.
6. Influence on Trade Policies
MNCs lobby governments for trade liberalization, favorable tax regimes, and investment treaties.
WTO and regional trade agreements are shaped significantly by corporate interests.
They encourage reduction of tariffs, opening markets for goods and services.
Positive Impacts of MNCs on Global Trading
1. Increased Efficiency & Lower Costs
MNCs exploit comparative advantages across countries—cheaper labor in Asia, advanced R&D in Europe, or abundant resources in Africa.
This leads to cost efficiency, making products affordable globally.
2. Market Expansion for Developing Nations
Countries gain access to international markets by integrating into MNC supply chains.
Example: Vietnam emerged as a textile and electronics hub thanks to MNC-led exports.
3. Enhanced Consumer Choices
Consumers worldwide enjoy diverse products—from Starbucks coffee to Samsung phones—reflecting cultural and trade interconnections.
4. Rising Standards of Living
Jobs created by MNCs, along with affordable goods, enhance purchasing power and lifestyles in host countries.
5. Stimulation of Competition
MNC entry often forces domestic firms to innovate, improve efficiency, and adopt international best practices.
Negative Impacts of MNCs on Global Trading
1. Economic Dependence & Vulnerability
Host nations may become overly dependent on MNCs for exports and employment.
Example: Mexico’s reliance on U.S. auto firms makes its trade highly vulnerable to U.S. policy changes.
2. Unequal Power Relations
MNCs sometimes exploit weak regulatory systems, extracting resources without fair returns to host nations.
Oil and mining companies in Africa often face criticism for resource exploitation.
3. Cultural Homogenization
Global brands replace local products, diluting cultural uniqueness.
McDonaldization or Coca-Colonization symbolizes cultural dominance.
4. Tax Avoidance & Profit Shifting
MNCs use complex accounting methods to shift profits to low-tax jurisdictions.
Example: Google and Apple have faced criticism for using tax havens.
5. Environmental Challenges
Global production driven by MNCs often leads to pollution, deforestation, and carbon emissions.
Fashion MNCs contribute significantly to fast fashion waste and water pollution.
6. Labor Exploitation
MNCs are accused of paying low wages, unsafe working conditions, and exploiting cheap labor.
Sweatshops in Southeast Asia producing garments for Western brands are prime examples.
MNCs and the Future of Global Trade
Digital Globalization:
E-commerce, cloud services, and fintech expand trade without traditional borders.
Geopolitical Tensions:
U.S.-China trade war shows MNCs must adapt supply chains to political risks.
Sustainability Pressure:
ESG (Environmental, Social, Governance) standards are pushing MNCs to adopt greener practices.
Technological Disruption:
AI, automation, and blockchain reshape trade operations, logistics, and transparency.
Deglobalization Trends:
Some countries are reshoring industries, reducing reliance on foreign supply chains.
MNCs must balance globalization with localization strategies.
Conclusion
Multinational Corporations are at the heart of global trade. They are engines of growth, technology transfer, and cultural exchange, but they also raise questions about fairness, sustainability, and sovereignty. As global trading continues to evolve in the 21st century, MNCs will remain both drivers and disruptors. Their influence is likely to increase as technology erases borders, but they must balance profit with responsibility.
Ultimately, the future of global trading will be shaped not only by governments and international institutions but also by the strategies, ethics, and adaptability of MNCs. Their choices will determine whether globalization leads to inclusive prosperity or deepening divides.

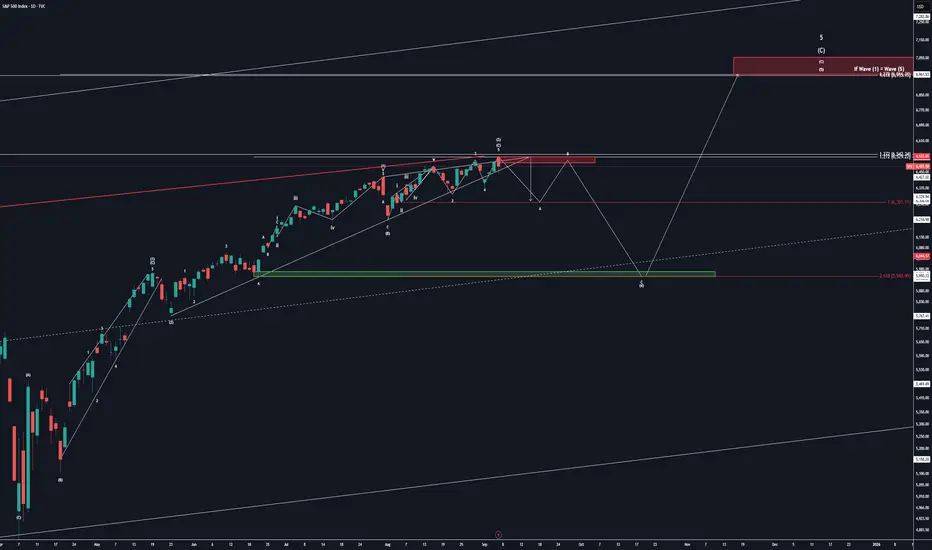
Melt-Up into FOMC - Post FED Expect CorrectionMore all-time highs
I shouldn't be upset (and I'm really not as the portfolio continues to make new YTD highs)
But technically, it is extremely frustrating to see nothing more than slow grind higher after slwo grind higher on the indexes - and also see blowout moves on individual stocks (ORCL, GOOGL, AVGO for example)
Rising Wedge still hasn't rolled over, resistance at 6500 hasn't been a wall yet
50 Day Moving Average is now over 90 bars from price. I could see price action melting up
into a crescendo or peak pre, during, or post FOMC and then fading lower after to find
some technical levels I've been eyeing for weeks
Enjoy the melt-up, just be ready for some action and volatility in the indexes, gold, silver,
bitcoin, and the bond/yield markets
I won't complain about YTD highs, but it's the caution ahead that I don't want to be
surprised by in the coming weeks
Plan accordingly - I'll continue to grind through it the best and safest way I know how
Thanks for watching!!!


S&P500 reactsd to US Inflation dataUS CPI rose to 2.9% YoY in August (vs. 2.7%), showing inflation is re-accelerating.
Markets still expect a 25bp Fed cut next week, but scope for deeper easing is reduced.
For equities, this means headwinds for tech and other rate-sensitive growth stocks, while defensives and commodity-linked sectors may hold up better.
Overall, the print adds to volatility ahead of the Fed meeting, with equities likely to trade cautiously.
Key Support and Resistance Levels
Resistance Level 1: 6590
Resistance Level 2: 6610
Resistance Level 3: 6630
Support Level 1: 6440
Support Level 2: 6410
Support Level 3: 6380
This communication is for informational purposes only and should not be viewed as any form of recommendation as to a particular course of action or as investment advice. It is not intended as an offer or solicitation for the purchase or sale of any financial instrument or as an official confirmation of any transaction. Opinions, estimates and assumptions expressed herein are made as of the date of this communication and are subject to change without notice. This communication has been prepared based upon information, including market prices, data and other information, believed to be reliable; however, Trade Nation does not warrant its completeness or accuracy. All market prices and market data contained in or attached to this communication are indicative and subject to change without notice.

SPX500 Awaits CPI – Pivot 6,527 in Focus (Details Below...)SPX500 – Overview
U.S. futures were flat Thursday as traders awaited the August CPI report, which could shape expectations for a potential 50bps Fed rate cut next week. Earnings from Kroger and Adobe are also due.
On Wednesday, the S&P 500 gained +0.3% and the Nasdaq +0.03% to fresh record highs after a surprise drop in PPI and strong Oracle guidance, while the Dow fell -0.48% on Apple weakness.
Technical Outlook
📉 Below 6,527 → bearish momentum may extend to 6,506 → 6,490 → 6,470.
📈 Above 6,527 → bullish bias continues toward 6,550 → 6,565, with a potential push to 6,600 if CPI comes in softer (<2.9%).
⚠️ A hotter CPI print could trigger sharp downside volatility.
Key Levels
Pivot: 6,527
Resistance: 6,550 – 6,565 – 6,600
Support: 6,506 – 6,490 – 6,470

SPX - 2 Month Bearish DivergenceHello Traders,
As shown you can see the two month bearish divergence on the index. My thoughts are it needs resolved soon than later and the inflation data coming up next could be the spark that finally gets it going.... We will find out tomorrow at 8:30 if the data comes in hot the market will not like that.. We could get a selloff in stocks and crypto on no other than 9-11 anniversary. Stay tunes and lets see if I nailed this one or not.

SPX 1D Close Up Corrective to (4) and finishing the year STRONG!Based on this count I believe that the markets will begin to go corrective starting this next week into October and finishing the year at higher highs. As always trade responsibly and wait for your confirmation bias (whatever that might be)...
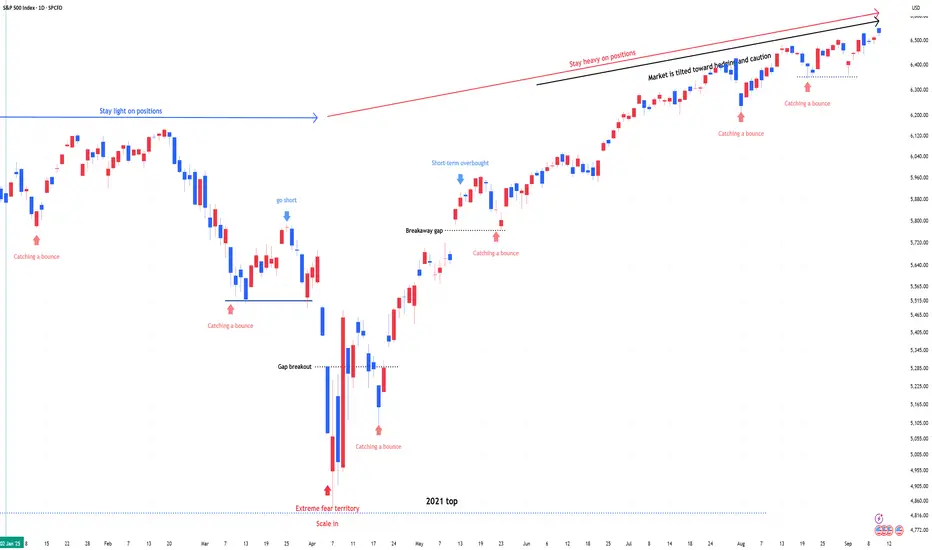
SPX & NDX : Stay heavy on positionsSPX & NDX : Stay heavy on positions (2x leverage)
Same view as before. No change
** This analysis is based solely on the quantification of crowd psychology.
It does not incorporate price action, trading volume, or macroeconomic indicators.
SPX500 Holds Above 6,527 Ahead of U.S. PPI DataSPX500 – Overview
Global equities rose early Wednesday as bets for a Federal Reserve rate cut next week strengthened after more weak U.S. jobs data. Traders now await the release of U.S. PPI today and CPI tomorrow, which may spark short-term volatility, though few expect them to alter the Fed’s plans.
Technical Outlook:
📈 The index remains in a bullish trend, with potential to set a new ATH near 6,550. A confirmed breakout above this level could open another bullish leg.
📉 To confirm bearish momentum, price would need to close a 1H candle below 6,527, exposing downside targets at 6,518 → 6,506.
Key Levels:
Pivot: 6,527
Resistance: 6,550 – 6,566
Support: 6,518 – 6,506

SPX500USD – Rejected at 6,550, Holding 6,490 SupportThe S&P 500 Index faced rejection at the 6,550 resistance zone after a strong bullish run. Price is now pulling back toward the 6,490 support, which will be key for buyers to defend in order to maintain upside momentum.
Support at: 6,490 / 6,455 / 6,350 🔽
Resistance at: 6,550 🔼
🔎 Bias:
🔼 Bullish: A rebound from 6,490 could retest 6,550, and a breakout above would extend gains.
🔽 Bearish: A break below 6,490 and 6,455 would expose the 6,350 zone.
📛 Disclaimer: This is not financial advice. Trade at your own risk.

SPX .A fake above 6660A fake nove above 6660.Now back in support for a rethink.Lets see if suppport holds.?

Major Global Soft Commodity Markets1. Understanding Soft Commodities
1.1 Definition and Classification
Soft commodities are raw materials that are cultivated, harvested, and traded for various purposes, including food, feed, fuel, and fiber. Unlike hard commodities such as metals and energy resources, softs are perishable and subject to seasonal cycles. They are typically traded on futures markets, allowing producers to hedge against price fluctuations and investors to speculate on price movements.
1.2 Key Characteristics
Perishability: Most soft commodities have a limited shelf life, requiring efficient storage and transportation systems.
Seasonality: Production cycles are influenced by planting and harvesting seasons, affecting supply and prices.
Geographic Concentration: Certain regions dominate the production of specific soft commodities, making them vulnerable to local disruptions.
Price Volatility: Prices can be highly volatile due to factors like weather events, pests, and geopolitical tensions.
2. Major Soft Commodities and Their Markets
2.1 Coffee
Coffee is one of the world's most traded commodities, with Brazil, Vietnam, and Colombia being the top producers. The market is influenced by factors such as climate conditions, currency fluctuations, and global demand trends. Futures contracts for coffee are traded on exchanges like ICE Futures U.S., providing a benchmark for global prices.
2.2 Cocoa
Cocoa is primarily produced in West Africa, with Ivory Coast and Ghana leading global production. The market has experienced significant price fluctuations due to supply deficits, often caused by adverse weather conditions and political instability in producing countries. The New York Cocoa Exchange, now part of ICE Futures U.S., plays a crucial role in setting global cocoa prices.
2.3 Sugar
Sugar is a staple in the global food industry, with Brazil, India, and China being major producers. The market is influenced by factors such as government policies, biofuel mandates, and global consumption patterns. Futures contracts for sugar are traded on exchanges like ICE Futures U.S., providing transparency and liquidity to the market.
2.4 Cotton
Cotton is essential for the textile industry, with China, India, and the United States being the largest producers. The market is affected by factors like weather conditions, labor costs, and global demand for textiles. Futures contracts for cotton are traded on exchanges such as ICE Futures U.S., offering a platform for price discovery and risk management.
2.5 Corn and Soybeans
Corn and soybeans are vital for food, feed, and biofuel industries. The United States is a leading producer of both crops, with significant exports to countries like China and Mexico. Futures contracts for these commodities are traded on exchanges like the CME Group, providing mechanisms for hedging and speculation.
2.6 Wheat
Wheat is a staple food for billions worldwide, with major producers including Russia, the United States, and China. The market is influenced by factors such as weather conditions, global demand, and trade policies. Futures contracts for wheat are traded on exchanges like the CME Group, offering a platform for price discovery and risk management.
3. Trading and Investment in Soft Commodities
3.1 Futures Markets
Futures markets are central to the trading of soft commodities, allowing producers to hedge against price fluctuations and investors to speculate on price movements. Exchanges like ICE Futures U.S. and the CME Group provide platforms for trading futures contracts, offering transparency and liquidity to the market.
3.2 Exchange-Traded Funds (ETFs)
ETFs provide investors with exposure to soft commodities without the need to directly trade futures contracts. For example, the Teucrium Corn Fund (CORN) and the Teucrium Soybean Fund (SOYB) offer investors a way to invest in these commodities through the stock market.
3.3 Physical Trading
Physical trading involves the buying and selling of actual commodities, often through long-term contracts between producers and consumers. Companies like ECOM Agroindustrial play a significant role in the physical trading of commodities such as coffee, cocoa, and cotton.
4. Factors Influencing Soft Commodity Markets
4.1 Weather and Climate Conditions
Adverse weather events like droughts, floods, and hurricanes can significantly impact the production of soft commodities, leading to supply shortages and price volatility.
4.2 Geopolitical Events
Political instability, trade disputes, and sanctions can disrupt supply chains and affect the prices of soft commodities.
4.3 Economic Policies
Government policies, such as subsidies, tariffs, and biofuel mandates, can influence the production and consumption of soft commodities, impacting their market dynamics.
4.4 Global Demand Trends
Changes in consumer preferences, population growth, and dietary habits can affect the demand for soft commodities, influencing their prices.
5. Challenges and Risks in Soft Commodity Markets
5.1 Price Volatility
Soft commodity markets are characterized by high price volatility due to factors like weather conditions, geopolitical events, and market speculation.
5.2 Supply Chain Disruptions
Natural disasters, transportation issues, and political instability can disrupt supply chains, leading to shortages and price increases.
5.3 Regulatory Uncertainty
Changes in government policies, such as trade restrictions and environmental regulations, can create uncertainty in the market.
6. Outlook for Soft Commodity Markets
6.1 Emerging Markets
Countries in Asia and Africa are becoming increasingly important players in the production and consumption of soft commodities, influencing global market trends.
6.2 Technological Advancements
Innovations in agricultural technology, such as precision farming and biotechnology, have the potential to improve yields and reduce the environmental impact of soft commodity production.
6.3 Sustainability Initiatives
There is a growing emphasis on sustainable practices in the production and trade of soft commodities, driven by consumer demand and regulatory pressures.
7. Conclusion
Soft commodities are integral to the global economy, influencing food security, industrial production, and trade dynamics. Their markets are complex and influenced by a myriad of factors, including weather conditions, geopolitical events, and economic policies. Understanding these markets is crucial for producers, traders, and investors alike to navigate the challenges and opportunities they present.
Will the U.S. Supreme Court strike down tariffs?In November 2025, the U.S. Supreme Court could issue a historic ruling: determining whether President Trump alone has the right to impose tariffs without going through Congress. Behind this legal debate lies a major issue for U.S. trade policy and the balance of powers.
The role of the Supreme Court
As the highest judicial authority in the country, the Supreme Court has the power to uphold or strike down any measure that does not comply with the Constitution. Its decisions are final and binding on all institutions. In this case, the Court must assess whether the President overstepped his authority by using the International Emergency Economic Powers Act (IEEPA) to impose tariffs.
Thanks to the principle of judicial review, the Court must verify whether the executive branch respects the separation of powers. For decades, presidents have invoked the IEEPA to act quickly, especially in times of economic tension. This practice, tolerated until now, is now being challenged.
A decisive choice – two possible outcomes:
• If the Court confirms presidential power, the White House will retain broad freedom to impose tariffs without immediate checks.
• If the Court limits or cancels this power, Congress will once again become the central actor in trade policy, slowing decisions but restoring institutional balance.
The issue goes beyond the legal framework. A confirmation would strengthen the executive and could encourage a more aggressive approach in international negotiations. Conversely, a restriction would force a return to legislative compromise, complicating the implementation of economic sanctions but providing greater predictability to trading partners.
A possible turning point for Fed monetary policy
This ruling could redefine U.S. trade policy for years to come. It will influence how Washington manages trade disputes, conducts international negotiations, and balances power between the President and Congress. It will also strongly impact the Fed’s future monetary policy trajectory and, more broadly, financial markets.
DISCLAIMER:
This content is intended for individuals who are familiar with financial markets and instruments and is for information purposes only. The presented idea (including market commentary, market data and observations) is not a work product of any research department of Swissquote or its affiliates. This material is intended to highlight market action and does not constitute investment, legal or tax advice. If you are a retail investor or lack experience in trading complex financial products, it is advisable to seek professional advice from licensed advisor before making any financial decisions.
This content is not intended to manipulate the market or encourage any specific financial behavior.
Swissquote makes no representation or warranty as to the quality, completeness, accuracy, comprehensiveness or non-infringement of such content. The views expressed are those of the consultant and are provided for educational purposes only. Any information provided relating to a product or market should not be construed as recommending an investment strategy or transaction. Past performance is not a guarantee of future results.
Swissquote and its employees and representatives shall in no event be held liable for any damages or losses arising directly or indirectly from decisions made on the basis of this content.
The use of any third-party brands or trademarks is for information only and does not imply endorsement by Swissquote, or that the trademark owner has authorised Swissquote to promote its products or services.
Swissquote is the marketing brand for the activities of Swissquote Bank Ltd (Switzerland) regulated by FINMA, Swissquote Capital Markets Limited regulated by CySEC (Cyprus), Swissquote Bank Europe SA (Luxembourg) regulated by the CSSF, Swissquote Ltd (UK) regulated by the FCA, Swissquote Financial Services (Malta) Ltd regulated by the Malta Financial Services Authority, Swissquote MEA Ltd. (UAE) regulated by the Dubai Financial Services Authority, Swissquote Pte Ltd (Singapore) regulated by the Monetary Authority of Singapore, Swissquote Asia Limited (Hong Kong) licensed by the Hong Kong Securities and Futures Commission (SFC) and Swissquote South Africa (Pty) Ltd supervised by the FSCA.
Products and services of Swissquote are only intended for those permitted to receive them under local law.
All investments carry a degree of risk. The risk of loss in trading or holding financial instruments can be substantial. The value of financial instruments, including but not limited to stocks, bonds, cryptocurrencies, and other assets, can fluctuate both upwards and downwards. There is a significant risk of financial loss when buying, selling, holding, staking, or investing in these instruments. SQBE makes no recommendations regarding any specific investment, transaction, or the use of any particular investment strategy.
CFDs are complex instruments and come with a high risk of losing money rapidly due to leverage. The vast majority of retail client accounts suffer capital losses when trading in CFDs. You should consider whether you understand how CFDs work and whether you can afford to take the high risk of losing your money.
Digital Assets are unregulated in most countries and consumer protection rules may not apply. As highly volatile speculative investments, Digital Assets are not suitable for investors without a high-risk tolerance. Make sure you understand each Digital Asset before you trade.
Cryptocurrencies are not considered legal tender in some jurisdictions and are subject to regulatory uncertainties.
The use of Internet-based systems can involve high risks, including, but not limited to, fraud, cyber-attacks, network and communication failures, as well as identity theft and phishing attacks related to crypto-assets.

Most underrated chart?? /// S&P500 /// $7500 bull market targetMost underrated chart out there? We are on the end of raging bull run where we broke out in 2013 and been going higher and higher since then. We gone top out at around $7500. The two green circles is where the points on the ray line is and the two other ray lines is a clone of that bottom line. Hope the chart is helpful. The stage is set. Hope this chart is helpful.

Will the Stock Market Ever Top?When it does, how long will that top last?
The question on the minds of many is just how high this blow-off top in the stock market will go. The cyclical bull market is running a bit long in the tooth and, by every conceivable measure, should be due for a healthy correction at the very least.
No, we’re not talking about the bull market run from the Tariff Tantrum lows in April; we’re talking about a 16-year run-up from the 2009 lows of the Great Financial Crisis—a low, in my view, that was never allowed to clear adequately.
The chart below illustrates the short-term, quintessential V-shaped recovery rebound from the April lows this past spring. These instant recoveries to fresh all-time highs have been a hallmark since the COVID bottom in 2020.
The daily chart above shows five clear waves of advance within a larger broadening pattern. Though a top can form at a moment’s notice from this point forward, the daily chart indicates two outstanding upside price targets at 7,006.88 and 7,431.22, respectively—each a Fibonacci extension of previous wave relationships.
Near-term downside targets ripe for the taking amid any meaningful pullback are represented by the four open gaps listed in the daily chart.
Next, we’ll zoom in a bit closer, looking at a 3-hour chart just before today’s close, with the S&P down slightly, just over half of one percent.
You can read the balance of the article, charts, and analysis at Wave-Tech's Charting the Fourth Turning .
Thanks for tuning in and for any support, comments, or suggestions you may have.

SPX Wave 4 nearZooming out to the longer-term view, it appears we are approaching a Wave 4 of a higher degree. After the completion of this corrective phase, I expect a final Wave 5 of the primary degree to unfold, likely carrying into the first quarter of next year, ( next year 1st 1/4 SPX 7,200-ish)

The next bubble? It is amazing to see the power of the U.S market.
The Economy and Wall Streets splitted paths a long time ago...
Inflation?
Wars?
Euro Zone Crisis?
Call it market manipulation or a rigid game... betting against the market should be only a short term strategy.


Close in on last segmentWell 6666 is the sign of the devil..Can it take that out .?
lets see what happens
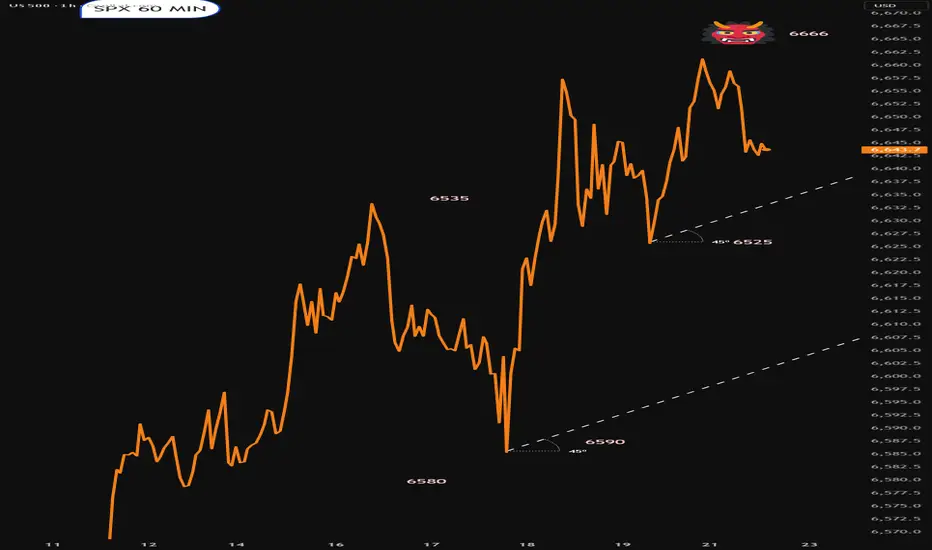
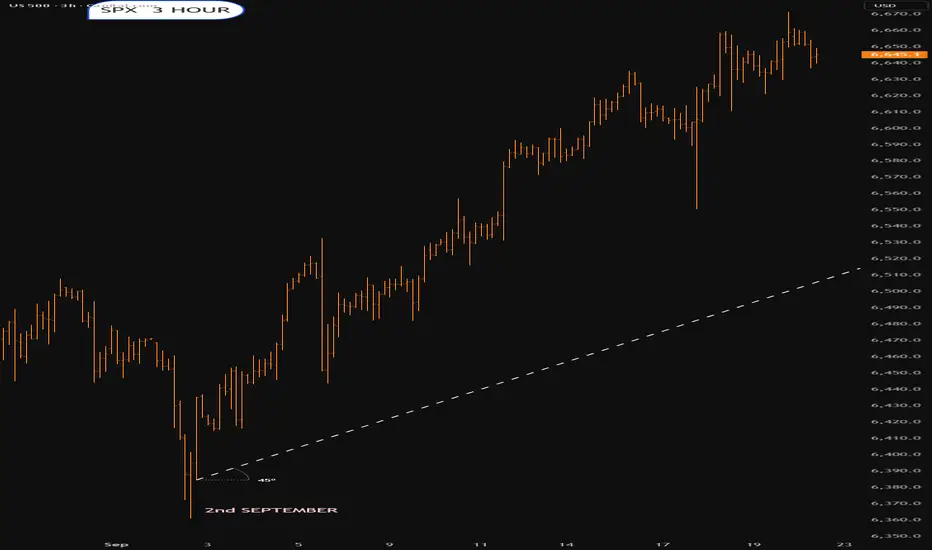
SPX despikedGot rid of some of the spikes to expose the trend.The range now seems to be 6590-6660 areas
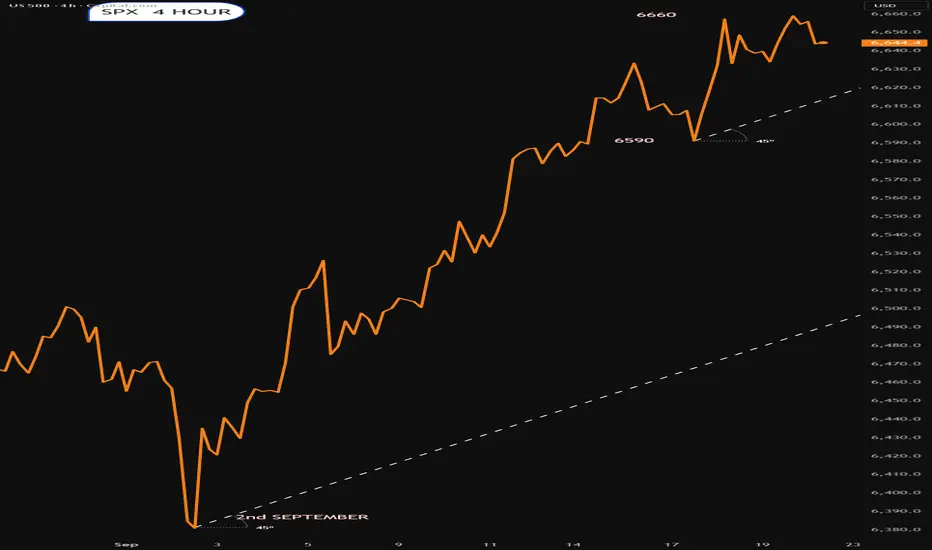
SPX into the open/Monday 22nd SeptemberTrend markedDare ya sell it.? Really needs to pull back.that might not happen
Fed easing and earnings fuel US500 (S&P500) rally, but headwindsFed easing and earnings fuel rally, but headwinds remain.
Technical Perspective
1. The S&P 500 extends its rally, holding firmly above bullish EMAs. The EMAs consistent gap confirms strong constant momentum, reinforcing the potential for further gains.
2. The next target is 7,000, @ 161.8% Fibonacci retracement, which may act as a potential exhaustion point for the current bullish trend.
3. However, a bearish divergence between price and RSI has developed, signaling the risk of a short-term pullback in the range of 150–300 points. Such a move would likely be corrective rather than a reversal before reaching the target.
4. A decisive break above 6,700 would strengthen the bullish outlook, opening the path toward the 7,000 target.
5. Conversely, if a correction unfolds, it would be an opportunity, initial support is seen around 6,500, “the resistance become support level” that could now serve as a strong support.
Fundamental Perspective
6. S&P 500 surged, fueled by the Fed rate cut decision for the first time since Dec2024 and the Fed’s dovish forward guidance which gave investors confidence about more rate cut.
7. Strong corporate earnings, combined with optimism around AI. The technology sector is a key driver, reinforcing bullish sentiment across the index. While other sectors got rotation effect sometimes.
9. However, there are some risks remain such as; if inflation unexpectedly return, forcing the Fed to adopt a more hawkish stance. On top of that, valuations are stretched: the S&P 500’s price-to-earnings ratio (PE) hovers above 27, above the 10-year average and even higher than the pre-COVID19. Such overvaluation could act as a headwind for the index going forward.
Analysis by: Krisada Yoonaisil, Financial Markets Strategist at Exness
