SPIUSD trade ideas

I believe the daily supply zone will be respected. I am shorting
ENTRY 6510.6
SL 6533.0
TP 6488.2
Also, the asset is currently overvalued versus the dollar and U.S bond.

SPX500 | Indexes Rise Ahead of JOLTS Data – Key Pivot 6,438S&P 500 & Nasdaq Futures – Update
Futures tied to the S&P 500 and Nasdaq rebounded on Wednesday, led by gains in Alphabet after its antitrust ruling. Dow futures edged slightly lower as traders await fresh labor market data. The focus today is the JOLTS report (10 a.m. ET), the first of several key releases this week, with nonfarm payrolls on Friday being the most important.
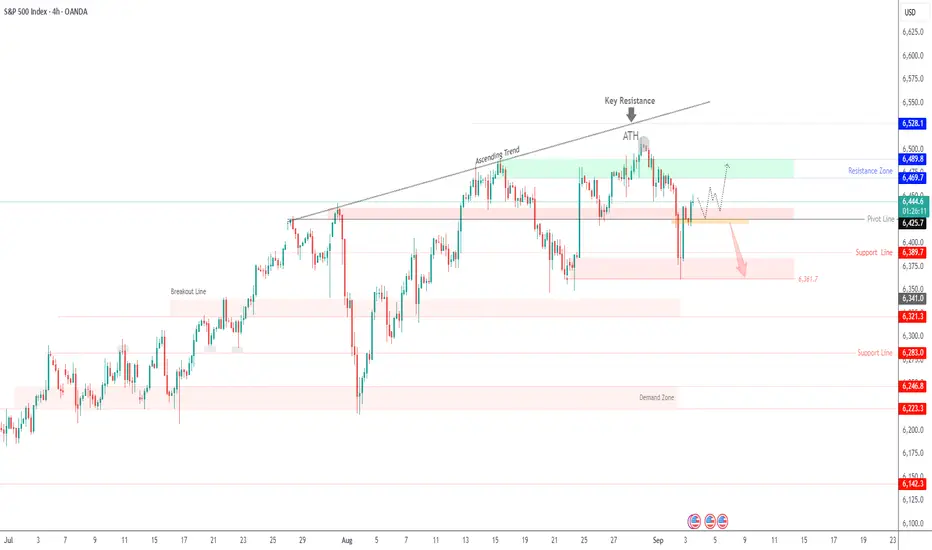
Technical Outlook (SPX500):
🔼 Price reversed from the 6,366 support mentioned in yesterday’s update and has now stabilized above the pivot line at 6,438.
As long as price holds above 6,438, upside momentum is expected toward 6,469 → 6,489, with extended resistance at 6,528.
🔻 On the downside, a confirmed 1H close below 6,420 would shift momentum bearish, exposing 6,389 → 6,361.
Key Levels:
Resistance: 6,469 – 6,489 – 6,528
Support: 6,420 – 6,389 – 6,361
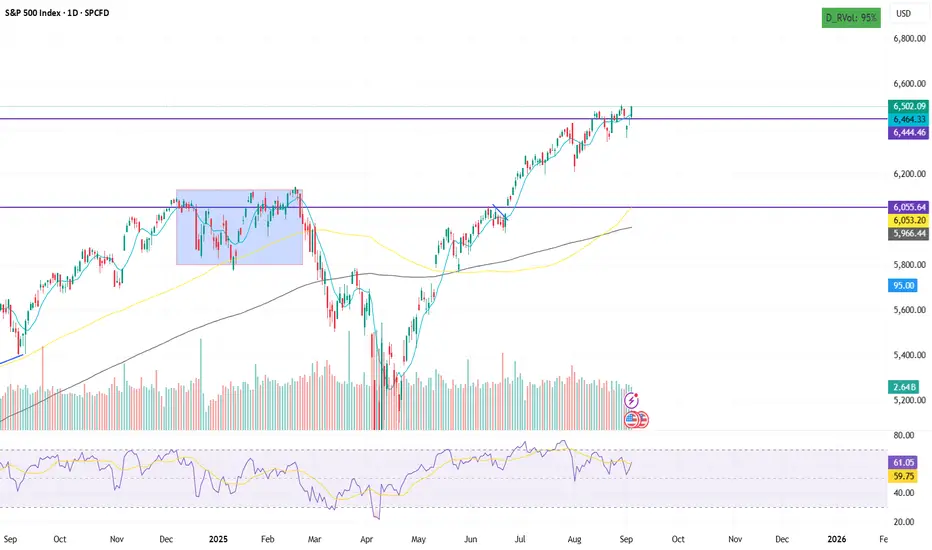
In September, the S&P 500 Index Reached a New All-Time HighIn September, the S&P 500 Index Reached a New All-Time High
September is a month that statistically has the worst reputation for the S&P 500. However, in 2025 things may be different, as today the index hit a record high, rising above 6,520 points.
Bullish sentiment is being driven by:
→ expectations of an interest rate cut in September, which is believed will give the US economy a positive boost (and increase corporate profits);
→ yesterday’s release of the ISM Services PMI (actual = 52.0, forecast = 50.9), which pointed to industrial growth;
→ strong corporate results – for example, Broadcom (AVGO) published a solid report yesterday.
Technical Analysis of the S&P 500 Chart
Analysing the 4-hour chart of the S&P 500 on 28 August, we:
→ identified a support zone below 6,370;
→ noted several bearish signals and suggested that 6,500 could act as psychological resistance (with a potential false bullish breakout).
Indeed, since then (as shown by the blue arrows):
→ the price made a false breakout above 6,500;
→ then dropped to 6,370 to test the support zone;
→ after which it turned upwards again, forming a broad bullish engulfing pattern.
New data allows us to refine the position of the short-term channel (marked in blue), with the following perspectives:
→ Bearish view: the price is close to the upper boundary of the channel, which already showed resistance this morning (highlighted by the red arrow) – the candlestick has a long upper shadow.
→ Bullish view: yesterday’s rally demonstrated signs of imbalance in favour of buyers (as detailed in the description of the Fair Value Gap pattern), and the breakout above 6,500 looks genuine (since the price is consolidating above it).
Both viewpoints seem to be well-reasoned, but the market is unlikely to remain in balance, as today (15:30 GMT+3) the release of US labour market data is scheduled – arguably the key event of the week in the economic calendar.
Depending on the figures, the S&P 500 might:
→ attempt to break through the upper boundary;
→ or retreat towards the median of the blue channel.
Be prepared for volatility spikes.
This article represents the opinion of the Companies operating under the FXOpen brand only. It is not to be construed as an offer, solicitation, or recommendation with respect to products and services provided by the Companies operating under the FXOpen brand, nor is it to be considered financial advice.

S&P | KEY RESISTANCE | GTradingMethodHello traders!
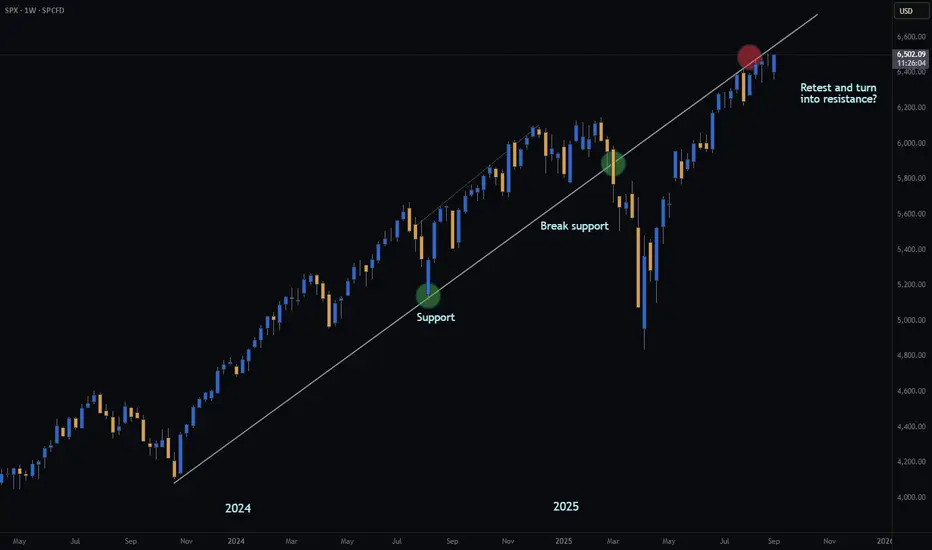
Has the S&P finally met its match?
Is this just a retest… or the beginning of a much deeper move?
- Broke diagonal support earlier this year
- Retesting previous support now
- Potential daily double top forming
If the retest holds, it’s a long way down… 📉
What are your thoughts? Keen to hear them :)
Signing off
G
SPX.Latest Move looking a tad overdoneThe chart says it all.No real comment needed.Lets see if this trend can be maintained.?
SPX. A fair bit of deviation from the trendlineSome would say its overbought.A fair bit of deviation.Can it continue like that without pulling back..?Very little commentary from me.The chart conveys the message
S&P500 | Daily Double Top | GTradingMethodHello Traders.
Welcome to today's trade idea by GTradingMethod.
🧐 Market Overview:
I’ve opened a short on the cash500 (S&P 500) at 6521. All GTradingMethod variables have been met, which means this trade setup qualifies under my system.
Additional confluences suggesting weaker buying strength include:
- RSI making lower highs while price pushed higher highs.
- Volume tapering off toward the latter part of the rally.
- MACD on sell signal
The only hesitation is that money flows have not decreased in the later stages of this move — but rules are rules. My edge is probability-based, so when my variables align, I must take the trade consistently.
📊 Trade Plan:
Risk/reward = 9.2
Entry price = 6520
Stop loss price = 6544
Take profit level 1 (50%) = 6370
Take profit level 2 (50%) = 6215
💡 GTradingMethod Tip:
A high RR doesn’t make a trade safer — it simply reflects how far the market could move relative to your risk. Always focus on process and probability, not just the potential payout.
🙏 Thanks for checking out my post!
Make sure to follow me to catch the next idea and please share your thoughts - I would like to hear them.
📌 Please note:
This is not financial advice. This content is to track my trading journey and for educational purposes only.

Exchange Rate Dynamics & FluctuationsPart 1: What Are Exchange Rates?
An exchange rate is essentially the price of one currency in terms of another. For example:
Direct quote: 1 USD = 83 INR → How many rupees per dollar.
Indirect quote: 1 INR = 0.012 USD → How many dollars per rupee.
Functions of Exchange Rates
Facilitate international trade – exporters and importers settle payments.
Enable cross-border investment – FDI, FIIs, bonds, equity markets.
Act as indicators of competitiveness – strong vs weak currency matters for exports.
Transmit global shocks – inflation, oil prices, interest rate changes often flow through currency movements.
Part 2: Exchange Rate Systems
Countries adopt different systems to manage their currencies:
Fixed Exchange Rate System
Currency pegged to gold or another currency (e.g., Bretton Woods system).
Provides stability but reduces flexibility.
Floating Exchange Rate System
Currency value determined purely by demand and supply in forex markets.
More volatile but allows automatic adjustment.
Managed Floating (Dirty Float)
Combination of both: central banks intervene occasionally to prevent extreme volatility.
Example: India’s rupee is a managed float.
Currency Pegs & Boards
Some countries peg their currencies to the US dollar or euro (e.g., Hong Kong dollar).
Offers stability but imports inflation/monetary policy from the anchor country.
Part 3: Theories of Exchange Rate Determination
Economists have proposed several models to explain exchange rate movements:
Purchasing Power Parity (PPP)
Currencies adjust to equalize the purchasing power of different countries.
Example: If a burger costs $5 in the US and ₹400 in India, then PPP exchange rate = 400/5 = 80.
Interest Rate Parity (IRP)
Interest rate differences between countries affect forward exchange rates.
Higher interest rates attract capital inflows, strengthening the currency.
Balance of Payments Approach
Exchange rate depends on trade balance (exports-imports) and capital flows.
Trade surplus strengthens currency; deficit weakens it.
Monetary Approach
Currency value linked to money supply and inflation.
Higher inflation depreciates a currency.
Asset Market Approach
Exchange rate determined by demand and supply of financial assets across countries.
Part 4: Key Drivers of Exchange Rate Fluctuations
1. Demand and Supply of Currencies
Like any commodity, exchange rates are influenced by demand and supply. If more people want dollars (for oil imports, for example), the dollar strengthens.
2. Interest Rates
High domestic interest rates attract foreign capital → appreciation of the local currency.
Low interest rates cause outflows → depreciation.
3. Inflation Rates
Countries with lower inflation rates tend to see currency appreciation, as purchasing power is preserved.
4. Trade Balance
Export surplus → stronger currency.
Import-heavy economy → weaker currency.
5. Foreign Direct Investment (FDI) and Portfolio Flows
When investors buy stocks, bonds, or companies in a country, they demand that country’s currency → appreciation.
6. Speculation and Market Sentiment
Traders often buy or sell currencies based on expectations. If markets expect the rupee to fall, speculative selling accelerates the decline.
7. Central Bank Intervention
Central banks sometimes buy/sell foreign currencies to stabilize their domestic currency.
Example: RBI selling dollars to support the rupee.
8. Geopolitical Events and Political Stability
Wars, elections, coups, and policy changes can trigger sharp movements.
9. Commodity Prices
Oil-exporting nations’ currencies (like Russia’s ruble) rise when oil prices rise.
Oil-importing countries (like India) see their currency weaken when oil becomes expensive.
10. Global Risk Appetite
During crises, investors flock to “safe haven” currencies (USD, CHF, JPY), causing them to appreciate.
Part 5: Types of Exchange Rate Fluctuations
Appreciation – Currency value rises (e.g., USD/INR falls from 83 → 80).
Depreciation – Currency value falls (e.g., USD/INR rises from 83 → 86).
Devaluation – Government/central bank officially reduces the currency’s value under fixed system.
Revaluation – Official increase in value.
Volatility – Short-term fluctuations due to speculative trading, news, or shocks.
Part 6: Real-World Examples
Asian Financial Crisis (1997)
Thai baht collapse spread across Asia.
Triggered by excessive borrowing and weak reserves.
Eurozone Debt Crisis (2010–12)
Euro weakened due to fears of Greek and other sovereign defaults.
COVID-19 Pandemic (2020)
Investors rushed into the dollar as a safe haven.
Emerging market currencies depreciated sharply.
Russia-Ukraine War (2022)
Ruble crashed initially, then recovered after capital controls and oil exports.
Indian Rupee Movements
1991 crisis forced devaluation.
2008 crisis → rupee fell due to capital outflows.
Recent years: rupee under pressure due to oil imports and strong US dollar.
Part 7: Implications of Exchange Rate Fluctuations
1. On Trade
A weaker currency makes exports cheaper, boosting demand abroad.
But it makes imports more expensive, adding inflationary pressure.
2. On Inflation
Import-dependent economies (like India with oil) see higher inflation when their currency depreciates.
3. On Investment
FIIs gain/loss depends on both stock performance and currency movement.
Currency depreciation can wipe out returns.
4. On Government Policy
Central banks adjust interest rates, intervene in forex markets, and build reserves.
5. On Common People
Travelers, students abroad, NRIs, and businesses all feel the effect of currency changes.
Part 8: Managing Exchange Rate Risk
Hedging with Derivatives
Forwards, futures, options, and swaps help companies lock in exchange rates.
Natural Hedging
Matching foreign currency revenues with expenses.
Diversification
Spreading trade and investments across multiple currencies.
Government Policies
Building forex reserves, imposing capital controls, or adjusting interest rates.
Part 9: The Future of Exchange Rate Dynamics
Digital Currencies
Central Bank Digital Currencies (CBDCs) may change cross-border payments.
Geopolitical Realignment
De-dollarization attempts by BRICS could alter forex dynamics.
Climate & Commodity Shocks
Weather events affecting agriculture and energy may impact currencies.
AI & Algorithmic Trading
High-frequency forex trading will increase volatility.
Conclusion
Exchange rate dynamics and fluctuations are at the heart of the global economy. They result from a complex interplay of trade, investment, inflation, interest rates, speculation, and geopolitics. No single factor explains all movements—currencies reflect the combined pulse of global markets.
For policymakers, managing exchange rates is a balancing act between stability and flexibility. For businesses, it’s a constant risk to hedge against. For investors, it’s both a challenge and an opportunity.
Ultimately, exchange rates are more than numbers—they represent the relative strength, stability, and future expectations of nations in the interconnected global system.
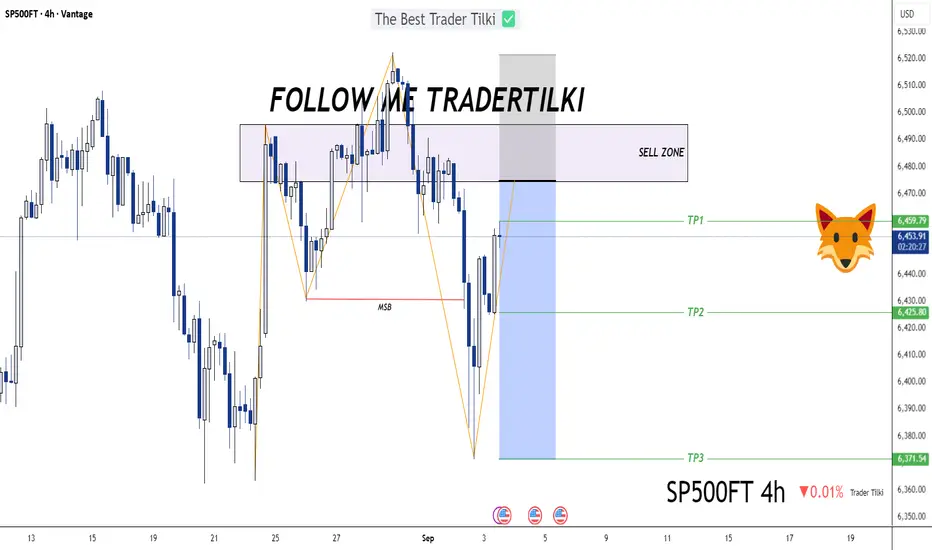
SP500 Structure Shift: Sell Zone ActivatedHey Guys 👋
I’ve prepared an SP500 analysis for you. Since the market structure has shifted, I’ll be opening a sell position from my designated sell zone.
📌 Entry: 6,474.90
📌 Stop: 6,522.12
🎯 TP1: 6,459.79
🎯 TP2: 6,425.80
🎯 TP3: 6,371.54
RISK REWARD - 2,21
Every single like you send my way is a huge source of motivation for me to keep sharing these analyses. Big thanks to everyone supporting with a like 🙏
30 US Year Gov Bond - May this never breakout. Government bonds are signaling higher inflation and not so great to lower interest rates. May this not breakout any soon.
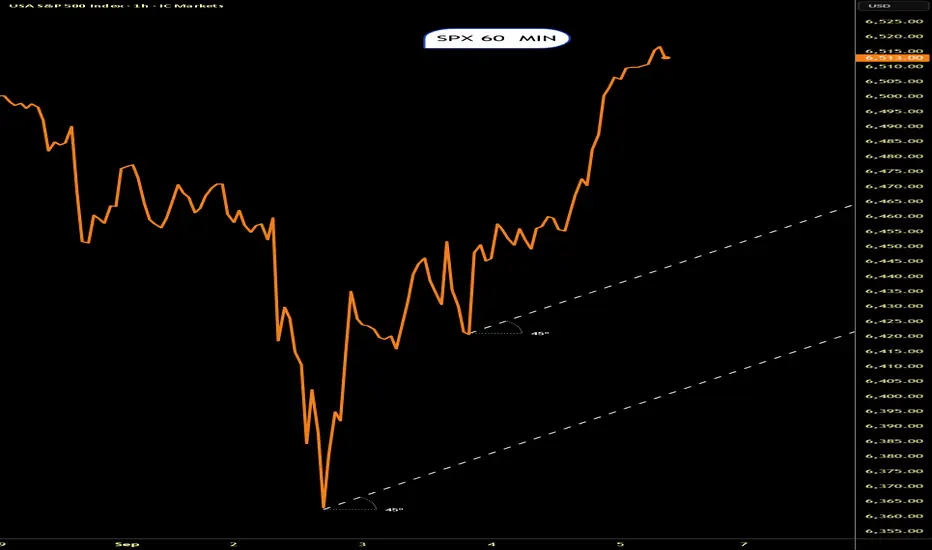
(Alchemy Markets) SP500 Elliott Wave Going into US Jobs ReportPrior to the open of the US session tomorrow, the US non-farm payrolls report is released. How will these numbers fair with a new chief labor statistician in place? We'll find out tomorrow.
Meanwhile, SPX appears to be carving a wedge. In Elliott wave terms, it would be an ending diagonal pattern.
The rally this week appears to be wave 5 of the five-wave pattern. RSI is diverging which is common on the final highs of this pattern. This implies an ending wave may be underway.
One of the rules of Elliott wave is that wave 3 cannot be the shortest between waves 1, 3, and 5. Therefore, since wave 3 is shorter than wave 1...this implies wave 5 must be shorter than 3.
Plopping that onto the chart, the current wave labeling shows a max price of 6,525. Now, of course price can go higher than 6,525, which would then require us to adopt an alternate wave count. If 6,525 is broken, then I would label the rally from Aug 19 thru today as wave 3. Still more upside, but similar outcome when the pattern does complete.
After the ending diagonal is finished, a swift retracement typically is experienced back to 6,212.

U.S. Macroeconomic DashboardThis is more of a cheatsheet/how-to for my own reference on my macro indicators charting layout. If the chart layout is helpful to the community, all the better! I find it useful for studying events and crises.
Indicators used: SPX, VIX, FEDFUNDS + US10Y + T10Y2Y, USIRYY + USCIR, UNRATE, USBCOI, BAMLH0A0HYM2, DXY
Row 1: Equity and volatility benchmarks
Row 2: Policy stance and inflation
Row 3: Unemployment and growth metrics
Row 4: Credit spreads and USD strength
SPX
Measuring : Equity benchmark
Relevance : Broadest market barometer
Observe : Trend direction, key levels, divergence vs other indicators
VIX
Measuring : Volatility index
Relevance : Market's implied volatility (read: "fear/greed gauge")
Observe : Spike --> risk-off, hedging demand; sustained lows --> complacency
FEDFUNDS + US10Y + T10Y2Y
Measuring : U.S. policy stance and yield curve
Relevance : Monetary tightening and loosening; yield curve recession slope
Observe : T10Y2Y curve inversion --> recession risk; bear steepening --> watch for inflation/deficit concerns; bull steepening --> Fed easing, recovery signal
USIRYY + USCIR
Measuring : Inflation
Relevance : Headline: all prices; Core: Excluding food + energy
Observe : Headline stat drives short-term moves. Core stat drives Fed policy
UNRATE
Measuring : Unemployment rate
Relevance : Labor market health (this is a lagging indicator)
Observe : Rising trend --> recession risk; very low --> possible overheating
USBCOI
Measuring : Manufacturing PMI; Business activity
Relevance : Leading growth indicator for manufacturing, services
Observe : >50 means expansion, <50 means contraction
BAMLH0A0HYM2
Measuring : U.S. High Yield Option-Adjusted Spread (the extra yield/spread investors demand to hold junk bonds vs risk-free Treasuries)
Relevance : Stress in corporate bond markets; risk sentiment
Observe : Widening --> investors demand more compensation for credit risk; narrowing --> investors are confident, low fear of defaults. 2-4 is normal, 4-6 is stressed, 6+ is distress, 10+ is crisis level
DXY
Measuring : USD strength
Relevance : Global liquidity, capital flows, financial conditions
Observe : Strong USD = tighter conditions and pressure on risk assets; inverse for weak USD

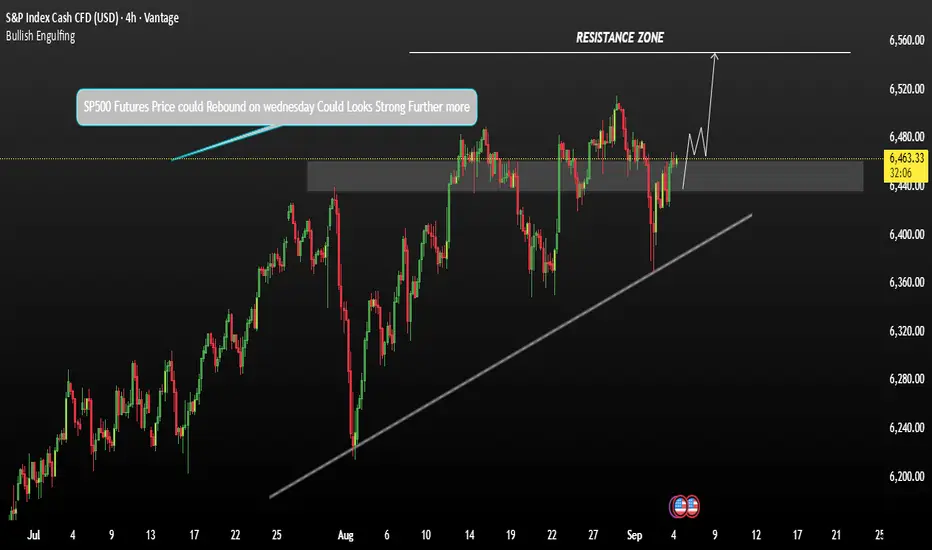
SP500 Futures Looks Reverse from support SP500 outlook On Wednesday, September 3, 2025, the S&P 500 rose by 0.5%, powered by substantial gains in Alphabet, which jumped over 9% following a favourable antitrust ruling. The Nasdaq also gained around 1%, while the Dow edged slightly lower by about 0.05%.
Analysts viewed this as a clear win for Alphabet and Apple, prompting raised price targets and renewed optimism for the broader tech sector.
S&P 500 futures climbed roughly 0.3%, and Nasdaq futures rose by about 0.7%, reflecting optimistic expectations for further upside. Fed officials signalled a possible rate cut, with investors pricing in a 96% chance of a 25 bps cut by the Fed meeting on September 17, 2025. The market now eyes Friday’s Nonfarm Payrolls report as the most critical release of the week, alongside the usual weekly data.
SP500 support around 64.30 (though SPY is currently at 6430, the level might reflect a different index or instrument) is interesting—the upside momentum appears to be heading toward resistance near 6,505,
You may find more details in the chart.
Trade wisely best of Luck.
Ps; Support with like and comments for better analysis.
TradingView Storytellers: Share Your Videos, Inspire TradersCalling all creators, chart wizards, and video storytellers.
👋 Hey traders !
We know many of you aren’t just analyzing the markets and trading — you’re teaching, creating, and inspiring others. We see you!
And now's your chance to get your content in the spotlight — share your best work with us. Top submissions will get featured front and center for the TradingView community.
👉 How to take part:
1️⃣ Share a short video (new or one you already have) that shows how you’re using your favorite TradingView features.
2️⃣ Submit it by filling out our quick questionnaire.
That’s it! Your work could be shared with thousands of traders around the world, inspiring others and helping grow our community of creators.
🎁 As a little thank you, we’ll be gifting three free Premium annual plans to standout submissions. And who knows — you might even end up collaborating with us in the future.
👉 Fill out the questionnaire
SPX500 ShortElite Analysis
Discretionary Trade
Targeting lower liquidity pools
Executed in a smaller time frame

US 500 – Preparing for the Pivotal US Non-Farm Payrolls ReleaseAfter a slow start to trading in September due to the US Labour Day bank holiday on Monday, volatility for US indices has picked up across the week as traders react to multiple drivers, including concerns about the sustainability of government debt in the US, Europe and the UK which weighed on sentiment Tuesday, big tech getting a key win in one of the biggest anti-trust cases for years which provided support off the lows, and updates on the current health of the US economy and labour market, including a slightly disappointing ISM Manufacturing PMI Survey on Tuesday, and a weaker than expected JOLTs Job Openings report on Wednesday afternoon.
Unsurprisingly, the different responses to these drivers has seen the US 500 index trade from a Monday high of 6483 to a low of 6363 on Tuesday and then move back higher again to current levels around 6450 (0700 BST), as traders cautiously initiate fresh risk positions to kick off the start of September.
However, it could be said that the two biggest data releases of the week for traders to digest may still be to come. The first is the US ISM Services PMI which is released later today at 1500 BST. This reading surprised markets last month by falling below expectations to 50.1, just above the 50 level which separates economic expansion and contraction. Traders will be looking to see whether this new print confirms a trend of weaker service activity or if the July reading was just a one-off blip.
Then on Friday, it’s the release that potentially every trader has been waiting for since Federal Reserve Chairman Powell mentioned concerns about the strength of the US labour market in his keynote speech from Jackson Hole, and noted how policymakers will be watching employment data closely to determine whether a rate cut at their meeting on September 17th would be appropriate to help support the economy. The outcome of the components of this release, including the unemployment rate and average hourly earnings could determine not only the direction of the US 500 into the weekend but how it performs across the early part of September, a month which is historically one of the worst for US 500 performance.
Technical Update: Trend Extension or Trend Reversal?
A bullish uptrend is defined by higher price highs and higher price lows, reflecting positive sentiment. Traders within this backdrop are seen to buy dips in price at a higher level each time and are able to push prices above the previous high.
As the chart above shows, the US 500 index appears a classic example of an uptrend, with a pattern of higher highs and higher lows emerging since the April 7th low.
While the US 500 index may currently be tracing out a bullish trend, further price strength isn’t guaranteed, especially with Friday’s payrolls data looming. This release has the potential to shift investor sentiment in either direction, so traders could find it useful to monitor key support and resistance levels closely.
Potential Resistance Levels to Monitor:
The recovery from the September 2nd low of 6363, which was above the prior August 20th low of 6347, suggests the uptrend remains intact, keeping the focus on the August 28th all-time high at 6512. A close above this level could signal further price strength.
While no guarantee of continued upside, a break above 6512 may open a path towards 6775, which is the 100% Fibonacci extension, and potentially higher.
Potential Support Levels to Monitor:
If the US 500 index is maintaining an uptrend in price, the potentially important support focus is the August 20th low at 6347. A close below 6347 could see a negative shift in sentiment and increase the risk of a deeper decline.
A close below 6347 might well be a trigger for renewed weakness, with potential then to test 6214, the August 1st low, and possibly further.
The material provided here has not been prepared accordance with legal requirements designed to promote the independence of investment research and as such is considered to be a marketing communication. Whilst it is not subject to any prohibition on dealing ahead of the dissemination of investment research, we will not seek to take any advantage before providing it to our clients.
Pepperstone doesn’t represent that the material provided here is accurate, current or complete, and therefore shouldn’t be relied upon as such. The information, whether from a third party or not, isn’t to be considered as a recommendation; or an offer to buy or sell; or the solicitation of an offer to buy or sell any security, financial product or instrument; or to participate in any particular trading strategy. It does not take into account readers’ financial situation or investment objectives. We advise any readers of this content to seek their own advice. Without the approval of Pepperstone, reproduction or redistribution of this information isn’t permitted.

SPX updated.Our support area heldUpdated chart.Our support area held and up we went.Will it continue being bullish.?


Rare Earth Metals & Geopolitical ImportanceIntroduction
In the 21st century, natural resources continue to shape geopolitics, economic power, and technological advancement. Just as oil defined much of the 20th century’s geopolitical struggles, rare earth metals (REMs) are increasingly being seen as the strategic resource of the digital and green-energy era. These 17 chemically similar elements—scattered in nature yet crucial for modern technologies—have become central to industries ranging from defense systems and electronics to renewable energy and electric mobility.
The geopolitical importance of rare earth metals arises from their scarcity in economically viable concentrations, their critical role in high-tech applications, and the fact that global production is highly concentrated in a few countries, particularly China. This combination of economic necessity and strategic vulnerability makes rare earth metals one of the most contested resources of our time.
This essay explores the science, applications, production dynamics, geopolitical tensions, and future outlook of rare earth metals. By the end, it becomes clear why these “hidden metals” are at the heart of modern geopolitics.
1. Understanding Rare Earth Metals
1.1 What Are Rare Earth Metals?
Rare earth metals are a group of 17 elements on the periodic table, specifically the 15 lanthanides plus scandium and yttrium. Despite their name, they are not particularly rare in the Earth’s crust. In fact, elements such as cerium are more abundant than copper. What makes them “rare” is that they are rarely found in concentrated, economically minable deposits. Extracting them is technically challenging and environmentally damaging, making supply chains vulnerable.
1.2 Types of Rare Earth Elements
They are typically divided into two categories:
Light Rare Earth Elements (LREEs): Lanthanum, cerium, praseodymium, neodymium, promethium, and samarium.
Heavy Rare Earth Elements (HREEs): Europium, gadolinium, terbium, dysprosium, holmium, erbium, thulium, ytterbium, lutetium, plus yttrium.
HREEs are generally scarcer and more geopolitically significant because they are harder to find and extract.
1.3 Properties That Make Them Critical
Rare earths have unique magnetic, luminescent, and electrochemical properties. For example:
Neodymium produces powerful permanent magnets.
Europium provides the red color in LED and display technologies.
Dysprosium improves magnet performance at high temperatures.
Lanthanum is used in camera lenses and batteries.
Such applications make them essential in modern life, often irreplaceable.
2. Strategic Applications of Rare Earth Metals
2.1 Consumer Electronics
Smartphones, laptops, tablets, and televisions rely heavily on rare earths. A smartphone alone may contain up to 8–10 different rare earth elements for screens, vibration motors, and microelectronics.
2.2 Renewable Energy
Wind turbines: Use large amounts of neodymium and dysprosium in permanent magnets.
Solar panels: Depend on cerium and europium for polishing glass and improving efficiency.
Electric vehicles (EVs): Motors require neodymium, praseodymium, and dysprosium.
The global push toward net-zero emissions is driving up rare earth demand exponentially.
2.3 Defense and Aerospace
Rare earths are essential in defense systems:
Jet engines (yttrium, europium)
Precision-guided munitions (neodymium magnets)
Communication systems
Radar and sonar technology
The U.S. Department of Defense considers them critical for national security.
2.4 Medical Technologies
MRI machines, X-ray intensifiers, and other diagnostic devices rely on rare earths such as gadolinium.
2.5 Industrial Uses
Catalysts in oil refining, glass polishing, and metallurgy all depend on rare earths, making them indispensable for both civilian and industrial economies.
3. Global Production and Supply Chain
3.1 China’s Dominance
China is the world’s largest producer of rare earths, accounting for 60–70% of global production and nearly 85–90% of processing capacity. This dominance emerged in the 1990s when China deliberately underpriced rare earth exports, forcing competitors in the U.S. and elsewhere to shut down due to environmental costs and unprofitability.
By controlling not just mining but also refining and manufacturing, China has become the hub of the rare earth supply chain.
3.2 Other Producers
United States: Mountain Pass mine in California is the largest rare earth mine outside China but depends on China for refining.
Australia: Lynas Corporation is a major non-Chinese producer.
India, Russia, Myanmar, and Brazil also contribute but at smaller scales.
3.3 Supply Chain Vulnerabilities
Mining rare earths is only the first step. Refining and separation are highly complex, and China’s near-monopoly over processing makes the global supply chain fragile. Disruptions in China could impact industries worldwide, from EVs to defense systems.
4. Environmental and Social Implications
4.1 Environmental Damage
Rare earth mining is associated with severe environmental impacts:
Radioactive waste (thorium and uranium traces).
Water pollution from acid leaching.
Deforestation and land degradation.
China’s Baotou region, a hub for rare earth mining, has been heavily polluted, leading to health and ecological crises.
4.2 Local Community Impact
Communities around rare earth mines face displacement, water scarcity, and long-term health risks. Balancing demand with sustainable mining practices remains a global challenge.
5. Geopolitical Importance
5.1 Rare Earths as a Strategic Resource
Like oil in the 20th century, rare earths are now “strategic resources.” Countries reliant on imports are vulnerable to supply disruptions, price manipulation, and geopolitical bargaining.
5.2 China’s Leverage
China has used rare earths as a geopolitical tool:
In 2010, China restricted exports to Japan amid territorial disputes, crippling Japan’s high-tech industry temporarily.
China has hinted at restricting supply to the U.S. during trade tensions.
Such actions demonstrate how resource control translates into geopolitical influence.
5.3 U.S. and Western Response
The U.S., EU, Japan, and Australia have launched initiatives to reduce dependency on China. These include:
Strategic stockpiling of rare earths.
New mining projects in Africa, Greenland, and Australia.
Research into recycling and substitutes for rare earths.
However, creating a parallel supply chain is costly and time-consuming.
5.4 Role in Green Energy Transition
As nations push for renewable energy and electric vehicles, rare earths are becoming central to climate policy. This adds another layer of geopolitical competition, as access to rare earths could determine leadership in green technology.
6. Emerging Geopolitical Trends
6.1 Resource Nationalism
Countries rich in rare earth deposits, such as Myanmar, Vietnam, and African nations, are increasingly asserting control. They see rare earths as a path to economic growth and geopolitical relevance.
6.2 Strategic Alliances
The Quad Alliance (U.S., India, Japan, Australia) has discussed collaboration in rare earth supply chains to counterbalance China. The EU is also exploring partnerships with African and Latin American producers.
6.3 Competition in the Arctic
Greenland has significant rare earth deposits. With melting ice making access easier, both China and Western nations are vying for influence in the Arctic region.
6.4 Technological Race
Nations are investing in R&D to find alternatives to rare earths or to improve recycling technologies. Whoever leads in this race could reduce dependence on geopolitically unstable supply chains.
7. Future Outlook
7.1 Demand Projections
The demand for rare earths is projected to triple by 2040, driven by:
Electric vehicles
Renewable energy installations
Advanced military technology
This means competition will intensify.
7.2 Recycling and Circular Economy
Recycling rare earths from e-waste and magnets offers a partial solution. However, technical and economic barriers remain significant.
7.3 Substitutes and Innovation
Some research is focused on developing magnet technologies that reduce reliance on rare earths. Success in this area could reshape the geopolitical importance of these elements.
7.4 Multipolar Supply Chains
Efforts by Australia, the U.S., and Europe to build alternative refining and mining operations could reduce China’s dominance over time, though it will take decades.
8. Case Studies
8.1 Japan’s Strategy Post-2010
After China restricted exports in 2010, Japan diversified its supply by investing in mines in Vietnam and Australia. It also accelerated recycling technologies, making Japan less vulnerable today.
8.2 U.S. Strategic Stockpiling
The U.S. Defense Production Act has been used to stockpile rare earths, particularly for defense applications, highlighting their importance in national security.
8.3 Africa as a Future Powerhouse
Countries like Malawi, Tanzania, and Madagascar hold significant deposits. China has already invested heavily in African mines, but Western nations are increasing their presence to secure supply.
9. Challenges Ahead
Balancing environmental concerns with rising demand.
Avoiding overdependence on a single producer nation.
Managing geopolitical rivalries without triggering resource wars.
Ensuring fair distribution of benefits for resource-rich but economically poor nations.
Conclusion
Rare earth metals are the invisible backbone of the digital, defense, and green revolutions. They may not dominate headlines like oil, but they are no less critical to global security and economic stability. Their importance lies not only in their industrial applications but also in the geopolitical leverage they confer upon producing nations.
As the world transitions toward renewable energy and advanced technologies, rare earths will become even more strategic. The competition over access, processing, and innovation will define geopolitical alignments in the coming decades. Nations that secure stable supply chains and invest in sustainable alternatives will gain a decisive advantage in the 21st-century global order.
In many ways, rare earths are the new oil—quietly powering economies, shaping foreign policies, and fueling the next era of great power competition.

SPX to 6900-7000 then back to the bull flag iT CaN ONLYly kEep goInG up
Not financial advice
4k is also a turnaround point but imo there's only one clear support here

Spx500 short Looking for shorts around this region.
S&p500 looks good.The only concern is will it take the ny highs .
That is why i placed my stop just above ny highs .
If anything we can still catch the short.

US500 Short Term Correction
US500 Snapshot
US500 is experiencing a sharp pullback driven by heightened risk aversion, rising Treasury yields, and defensive repositioning ahead of major US macro data releases. Sentiment turned noticeably bearish, and technical patterns point to a shift towards correction after months of bullish momentum.
Fundamental
Broad sentiment was bearish today while equities declined and volatility (VIX) spiked.
Defensive sectors (utilities, healthcare, consumer staples) outperformed while tech and growth stocks led losses. Investors are responding to seasonal September risks, rising bond yields near 4.5%, Fed rate cut uncertainty, and anxiety from recent legal and policy headlines
Technical
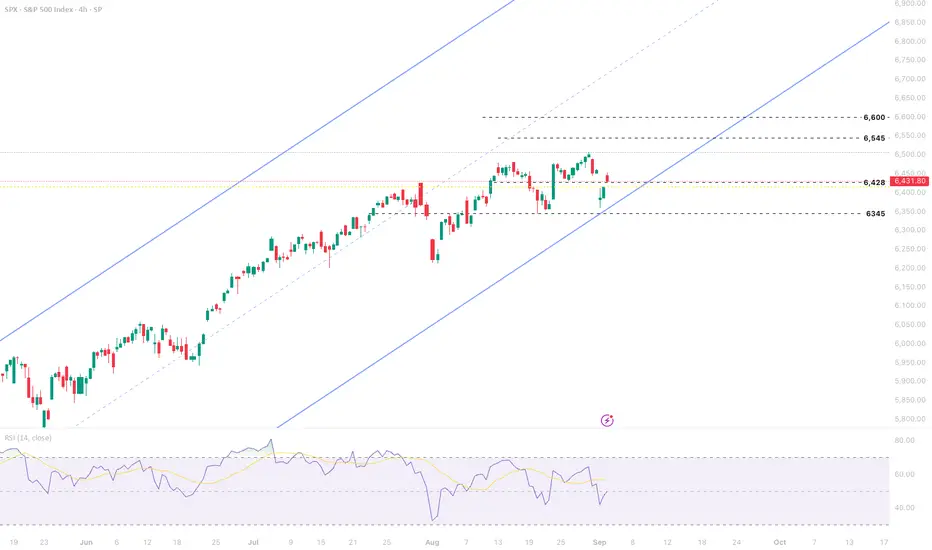
The index is now in a short term correction, ending a strong summer rally and moving off all time highs, reflective of portfolio rebalancing and increased caution typical for September.
A confirmed daily close below 6,336 would increase the likelihood of a deeper retracement wave targeting 6,000
Current momentum favors near term downside until macro trends, notably labor data and Fed signals, clarify the outlook.
Momentum has shifted towards testing the downside with 6,345 – 6,336 as critical areas to monitor for increased volatility and potential accelerated selling
Key Levels
Resistance 6,500 –6,545, Recent all-time high region, upside cap
Support 6,428 First key support,
Strong Support 6,345 Lower floor, downside target if selling persists
Analysis by Terence Hove, Senior Financial Markets Strategist at Exness