Five Bubbles, One ChartEvery Bubble Peaks Near 40%
This chart puts five manias side by side on one scale. Utilities and industrials in the 1920s, the Nifty Fifty, Japan, the dot-com era, and AI (Artificial Intelligence). Each curve is the share of the market held by that era's leaders: the climb, the peak, the collapse.
S&P 500 Index
No trades
No trades
Compare with S&P 500
S&P 500 market breadth
AdvancingDeclining
319 · 63%184 · 37%
Net advances
+135
A/D ratio
1.73
Up / down volume
1.4 B / 1.3 B
Index info
ISIN
US78378X1072
CUSIP
78378X107
FIGI
BBG000H4FSM0
Identifiers
ISIN US78378X1072
Standard and Poor's 500 Index is a capitalization-weighted stock market index measuring the performance of 500 large publicly traded companies in the United States. This index covers a wide range of industries, including technology, healthcare, energy, and finance. It serves as a benchmark for the overall health of the U.S. stock market, as well as a reflection of the country's economic strength.
Substantial gains in the S&P 500 are often interpreted as positive signals for the economy, while losses can be seen as indicators of potential trouble. Investors use this index as a barometer for their own portfolios and to assess the performance of individual stocks. The S&P 500 index plays a vital role in the financial world and is closely watched by analysts and policymakers.
S&P 500 Looks Very Bullish (3H)From the point where we placed the red arrow on the chart, a corrective structure has been developing on the .
Based on the current price action and the internal structure of the correction, this movement appears to be forming a Double Combination. The market has already completed a significant po
SPX500 1H:Bearish Rejection Resistance Area & Channel BreakdownSPX500 1H: Bearish Rejection at Resistance Area & Channel Breakdown
SPX500 (TVC:SPX500) has rejected the upper Resistance Area (7,800.0 - 7,830.0) on the 1H timeframe and broken below its primary ascending channel support. Price is currently consolidating near 7,779.3, following a clear downward str
S&P 500: The 12-Month Target of Institutional InvestorsIn an analysis published on TradingView last week, I explained the main reason behind the continuation of the stock market’s underlying uptrend: valuation.
Corporate profits and earnings prospects for S&P 500 companies are so substantial that, despite the index reaching new record highs, the stock
US500 :Bond Market Stress Builds-7,645 Is the Key LevelUS500 :Bond Market Stress Builds-7,645 Is the Key Level
Today, 10-year Treasury yields briefly hit 5.31% earlier in the day, the highest since 2007. That leaves borrowing costs at uncomfortable levels for stocks, as Treasuries suffered their worst quarter since 1994.
The pressure on US Treasury y
Hellena | SPX500 (4H): LONG to the 7880.0 resistance area.The bullish SPX500 scenario remains valid. The current price action suggests that higher-degree wave "1" is still developing, and the final stage of the advance may extend further than previously anticipated.
Following the completion of intermediate wave "4" at 7519.3, price resumed its advance. I
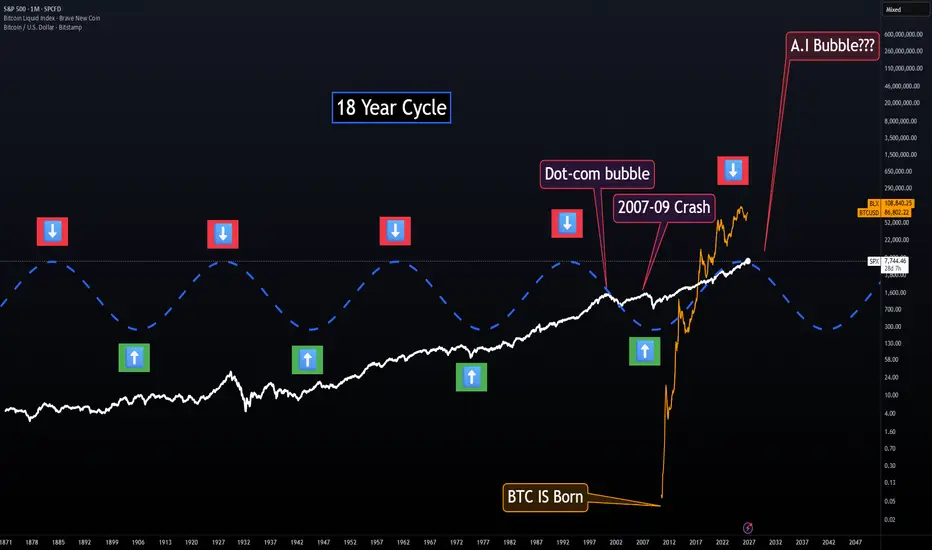
18-Year Cycle — Visual ModelThis is an easy-to-read visual version of my 18-Year Cycle model.
If you’re a visual person like me, this unfinished version makes the cycle much easier to see. The green arrows represent the stronger/good periods of the cycle, while the red arrows represent the higher-risk periods where major mark
Going over todays price action on the markets 10/05/26On todays video I go over with subscribers my levels of support and resistance and what I make out of the price action today. There are warning signs in the charts and also something isn't right and something is a miss in the markets, I believe we will find out soon!
See all ideas
Summarizing what the indicators are suggesting.
Oscillators
Neutral
Oscillators
Neutral
Summary
Neutral
Summary
Neutral
Summary
Neutral
Moving Averages
Neutral
Moving Averages
Neutral
Displays a symbol's value movements over previous years to identify recurring trends.
Frequently asked questions
S&P 500 Index reached its highest quote on Oct 6, 2026 — 7,844.52 POINT. See more data on the S&P 500 Index chart.
The lowest ever quote of S&P 500 Index is 2.73 POINT. It was reached on Jun 1, 1877. See more data on the S&P 500 Index chart.
S&P 500 Index value has increased by 1.29% in the past week, since last month it has shown a 0.62% increase, and over the year it's increased by 15.55%. Keep track of all changes on the S&P 500 Index chart.
The champion of S&P 500 Index is NASDAQ:SNDK — it's gained 1.15 K% over the year.
The weakest component of S&P 500 Index is NASDAQ:FISV — it's lost −64.05% over the year.
S&P 500 Index is just a number that lets you track performance of the instruments comprising the index, so you can't invest in it directly. But you can buy S&P 500 Index futures or funds or invest in its components.
The S&P 500 Index is comprised of 503 instruments including NASDAQ:NVDA, NASDAQ:AAPL, NASDAQ:GOOGL and others. See the full list of S&P 500 Index components to find more opportunities.