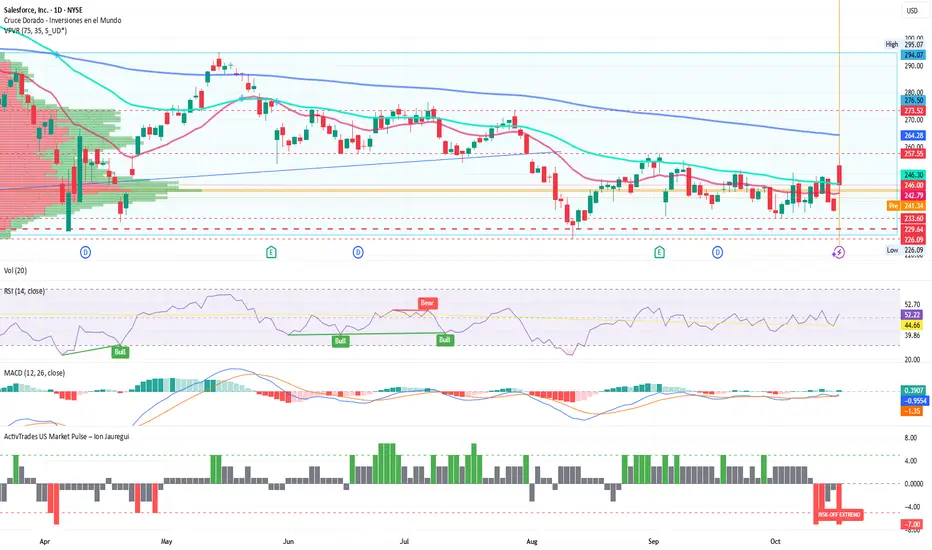
How to Generate More Profits During Earnings SeasonWho is in control of Price on the Day of the Earnings season CEO reports requires studying the stock chart 2-4 weeks ahead of the estimated date of the report.
Smaller Funds activity will disrupt runs intraday.
Professional Trading Companies are very active.
HFTs AI are making huge errors causing wh
Key facts today
Next report date
—
Report period
—
EPS estimate
—
Revenue estimate
—
6.10 EUR
5.98 B EUR
36.59 B EUR
927.17 M
About Salesforce, Inc.
Sector
Industry
CEO
Marc Russell Benioff
Website
Headquarters
San Francisco
Founded
1999
ISIN
US79466L3024
FIGI
BBG000FVBQ95
Salesforce, Inc. engages in the design and development of cloud-based enterprise software for customer relationship management. Its solutions include sales force automation, customer service and support, marketing automation, digital commerce, community management, collaboration, industry-specific solutions, and salesforce platform. The firm also provides guidance, support, training, and advisory services. The company was founded by Marc Russell Benioff and Parker Harris in 1999 and is headquartered in San Francisco, CA.
Related stocks

CRM LONG TO $510 - CALL HAS LEGS, THE NUMBERS JIVE, READ ON!Salesforce (CRM) stands out in the market with strong premium valuations justified by robust financial performance, innovative AI-driven products, and disciplined capital management, all pointing toward a bullish but measured long-term outlook.
First, key valuation ratios reveal Salesforce’s high m

Salesforce Reinvents Itself with AI and Projects Over $60BSalesforce Reinvents Itself with AI and Projects Over $60B by 2030
By Ion Jauregui – Analyst at ActivTrades
Salesforce (NYSE:CRM) has staged a true comeback in 2025, following the announcement of its ambitious forecast to surpass $60 billion in revenue by 2030. The global leader in CRM software h
CRM STOCK ANALYSIS Market Risk
Stock prices can fluctuate due to overall market movements caused by economic changes, political events, interest rate adjustments, or global crises. Even strong companies can lose value during market downturns.
Company-Specific Risk
The performance of an individual company can affect i
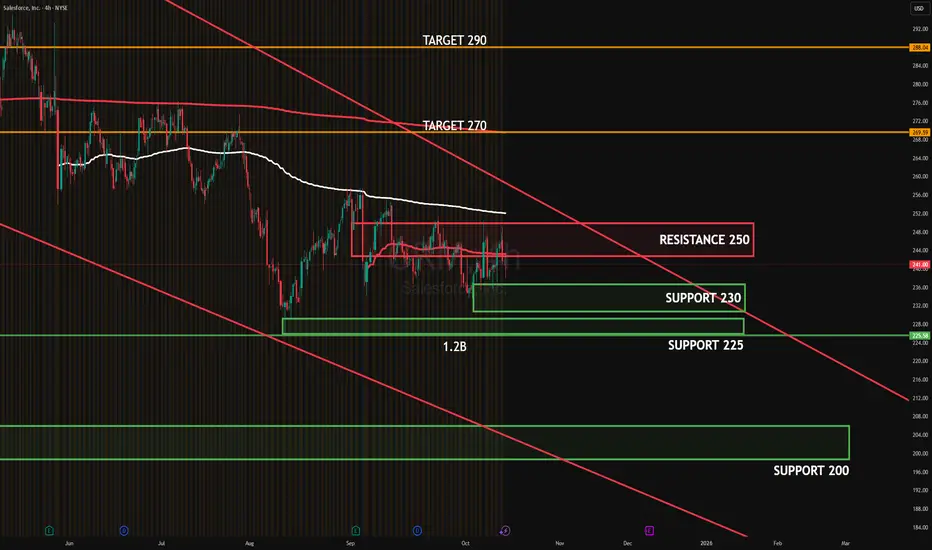
CRM OCT 2025CRM 4H: Price remains capped by 246–250 supply under the descending trendline, while buyers continue to defend 230–225 demand. The 230 test showed notable absorption (~1.2B), suggesting that institutions supported the dip; however, until 250 is reclaimed, that area acts as a distribution point.
Tar
CRM – Daily Chart | Holding Key Demand Zone Before Possible Reve⚙️ Key Levels
Zone Level Description
🔴 Major Resistance (Retail Zone) 367.09 Prior structural peak and key distribution area. Any rally back toward this level may face heavy selling pressure.
🟣 Extended Target Zone 451.81 Long-term Fibonacci extension level; full recovery point if momentum re-enter

CRM Is A Buy Hello,
CRM is running in an ending diagonal, as last phase of correction.
Targets:
1) $300
2) $330
3) $370

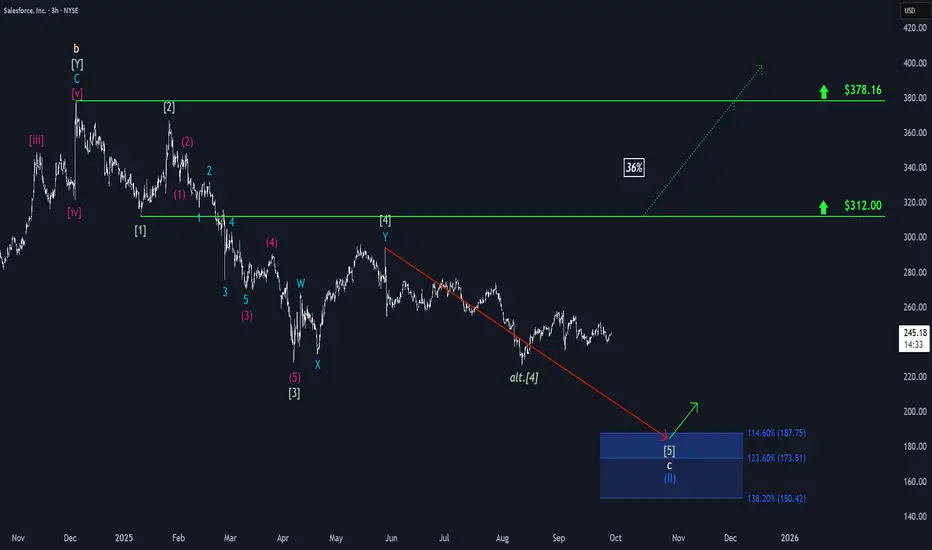
Salesforce: Trading SidewaysSalesforce has struggled to gain clear momentum in either direction over the past two weeks, which has resulted in mostly sideways trading. Looking ahead, we continue to anticipate renewed downward pressure in the near term, which could push the stock into our blue Target Zone between $187.75 and $1
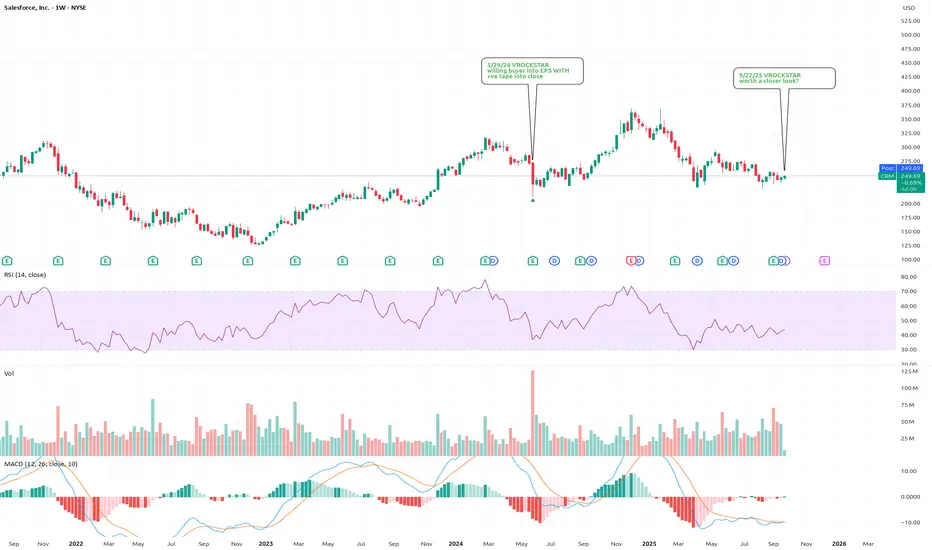
9/22/25 - $crm - worth a closer look?9/22/25 :: VROCKSTAR :: NYSE:CRM
worth a closer look?
- seems like the market wants the mega caps and the micro memes, but nothing in between
- that's what brought me back to NYSE:FI in the last few days (it's about a 20% position or 8% leveraged 2.5-1 on a series of jan '28 ITM leaps)
- now i'
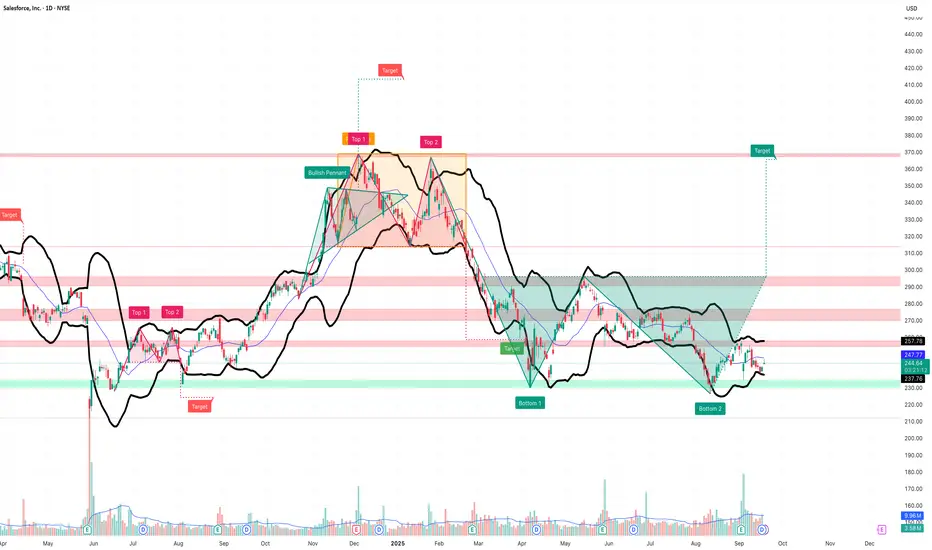
Bullish Strategy on Salesforce (CRM)
Bullish Strategy on Salesforce (CRM)
Looking at the daily chart of CRM, several technical signals support a medium-term bullish outlook:
Double Bottom Pattern
A clear double bottom (Bottom 1 and Bottom 2) has formed between April and September.
This classic reversal pattern often signals the end o
See all ideas
Summarizing what the indicators are suggesting.
Neutral
SellBuy
Strong sellStrong buy
Strong sellSellNeutralBuyStrong buy
Neutral
SellBuy
Strong sellStrong buy
Strong sellSellNeutralBuyStrong buy
Neutral
SellBuy
Strong sellStrong buy
Strong sellSellNeutralBuyStrong buy
An aggregate view of professional's ratings.
Neutral
SellBuy
Strong sellStrong buy
Strong sellSellNeutralBuyStrong buy
Neutral
SellBuy
Strong sellStrong buy
Strong sellSellNeutralBuyStrong buy
Neutral
SellBuy
Strong sellStrong buy
Strong sellSellNeutralBuyStrong buy
Displays a symbol's price movements over previous years to identify recurring trends.
US79466LAM6
Salesforce, Inc. 3.05% 15-JUL-2061Yield to maturity
5.28%
Maturity date
Jul 15, 2061
CRM5214232
Salesforce, Inc. 2.9% 15-JUL-2051Yield to maturity
5.24%
Maturity date
Jul 15, 2051
US79466LAK0
Salesforce, Inc. 2.7% 15-JUL-2041Yield to maturity
5.05%
Maturity date
Jul 15, 2041
US79466LAJ3
Salesforce, Inc. 1.95% 15-JUL-2031Yield to maturity
4.05%
Maturity date
Jul 15, 2031
US79466LAH7
Salesforce, Inc. 1.5% 15-JUL-2028Yield to maturity
3.75%
Maturity date
Jul 15, 2028
CRM4619522
Salesforce, Inc. 3.7% 11-APR-2028Yield to maturity
3.68%
Maturity date
Apr 11, 2028
See all FOO bonds
Curated watchlists where FOO is featured.


Frequently Asked Questions
The current price of FOO is 219.10 EUR — it has decreased by −0.09% in the past 24 hours. Watch Salesforce, Inc. stock price performance more closely on the chart.
Depending on the exchange, the stock ticker may vary. For instance, on SWB exchange Salesforce, Inc. stocks are traded under the ticker FOO.
FOO stock has risen by 5.02% compared to the previous week, the month change is a 6.67% rise, over the last year Salesforce, Inc. has showed a −18.93% decrease.
We've gathered analysts' opinions on Salesforce, Inc. future price: according to them, FOO price has a max estimate of 369.26 EUR and a min estimate of 189.78 EUR. Watch FOO chart and read a more detailed Salesforce, Inc. stock forecast: see what analysts think of Salesforce, Inc. and suggest that you do with its stocks.
FOO stock is 0.59% volatile and has beta coefficient of 1.25. Track Salesforce, Inc. stock price on the chart and check out the list of the most volatile stocks — is Salesforce, Inc. there?
Today Salesforce, Inc. has the market capitalization of 208.85 B, it has increased by 11.72% over the last week.
Yes, you can track Salesforce, Inc. financials in yearly and quarterly reports right on TradingView.
Salesforce, Inc. is going to release the next earnings report on Dec 9, 2025. Keep track of upcoming events with our Earnings Calendar.
FOO earnings for the last quarter are 2.55 EUR per share, whereas the estimation was 2.43 EUR resulting in a 4.71% surprise. The estimated earnings for the next quarter are 2.46 EUR per share. See more details about Salesforce, Inc. earnings.
Salesforce, Inc. revenue for the last quarter amounts to 8.97 B EUR, despite the estimated figure of 8.88 B EUR. In the next quarter, revenue is expected to reach 8.82 B EUR.
FOO net income for the last quarter is 1.65 B EUR, while the quarter before that showed 1.36 B EUR of net income which accounts for 21.48% change. Track more Salesforce, Inc. financial stats to get the full picture.
Yes, FOO dividends are paid quarterly. The last dividend per share was 0.35 EUR. As of today, Dividend Yield (TTM)% is 0.65%. Tracking Salesforce, Inc. dividends might help you take more informed decisions.
Salesforce, Inc. dividend yield was 0.47% in 2024, and payout ratio reached 25.15%. The year before the numbers were 0.00% and 0.00% correspondingly. See high-dividend stocks and find more opportunities for your portfolio.
As of Oct 28, 2025, the company has 76.45 K employees. See our rating of the largest employees — is Salesforce, Inc. on this list?
EBITDA measures a company's operating performance, its growth signifies an improvement in the efficiency of a company. Salesforce, Inc. EBITDA is 12.15 B EUR, and current EBITDA margin is 34.93%. See more stats in Salesforce, Inc. financial statements.
Like other stocks, FOO shares are traded on stock exchanges, e.g. Nasdaq, Nyse, Euronext, and the easiest way to buy them is through an online stock broker. To do this, you need to open an account and follow a broker's procedures, then start trading. You can trade Salesforce, Inc. stock right from TradingView charts — choose your broker and connect to your account.
Investing in stocks requires a comprehensive research: you should carefully study all the available data, e.g. company's financials, related news, and its technical analysis. So Salesforce, Inc. technincal analysis shows the buy rating today, and its 1 week rating is sell. Since market conditions are prone to changes, it's worth looking a bit further into the future — according to the 1 month rating Salesforce, Inc. stock shows the neutral signal. See more of Salesforce, Inc. technicals for a more comprehensive analysis.
If you're still not sure, try looking for inspiration in our curated watchlists.
If you're still not sure, try looking for inspiration in our curated watchlists.