HD - Ready for Breakout. Hourly Channel BreakoutGood looking chart next week breakout. Monthly option of 395 would be ideal.
Home Depot, Inc.
No trades
Next report date
—
Report period
—
EPS estimate
—
Revenue estimate
—
12.75 EUR
14.29 B EUR
154.01 B EUR
994.80 M
About Home Depot, Inc. (The)
Sector
Industry
CEO
Edward P. Decker
Website
Headquarters
Atlanta
Founded
1978
IPO date
Apr 19, 1984
Identifiers
3
ISIN US4370761029
The Home Depot, Inc. engages in the sale of building materials and home improvement products. Its products include building materials, home improvement products, lawn and garden products and decor products. The firm operates through the following geographical segments: U.S., Canada and Mexico. It offers home improvement installation services, and tool and rental equipment. The company was founded by Bernard Marcus, Arthur M. Blank, Kenneth Gerald Langone and Pat Farrah on June 29, 1978 and is headquartered at Atlanta, GA.
Related stocks

Close over MA200Key Statistics:
* Signal: Price close over MA200
* Historical Win Rate (1 Year): 70.37%
* Average Return (1 Year): +42,16%
* Backtest Period: 1981 – 2026
Analysis:
The data suggests that Home Depot provides a reliable edge with the 1-year win rate staying above 70% while the average return jumps to

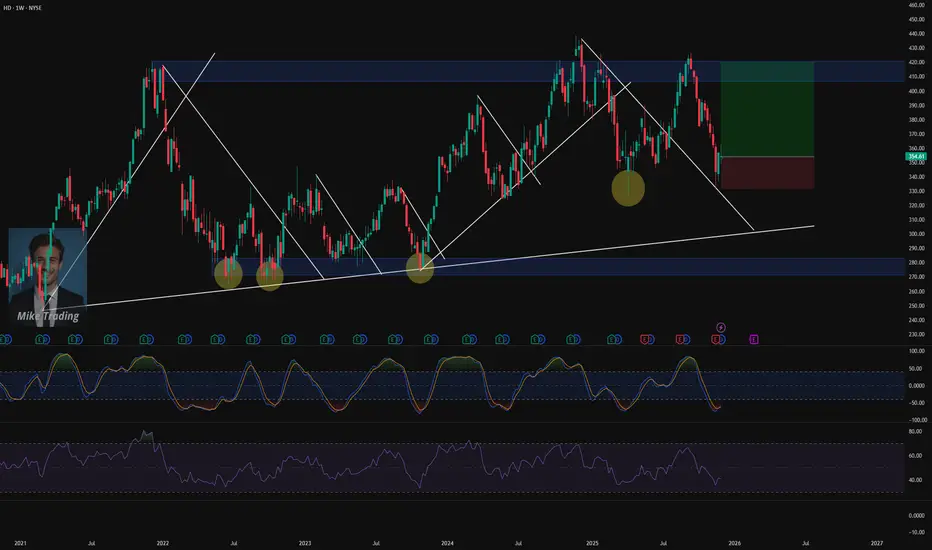
Home Depot: More Room on the UpsideHome Depot has been able to achieve further gains as planned, thus making progress within the magenta wave , which still has a little more room on the upside to reach its top. After that, we expect strong sell-offs into our green Long Target Zone between $313.69 and $287.01, to the low of the large

HD: The AVWAP Reclaim (Be Careful of the Ceiling)Everyone loves a V-shaped recovery, but we need to look at where the volume is actually transacting.
Looking at the Cantillon Institutional Overlay, we can see Home Depot has spent the last month building a massive base. Here is the technical breakdown of this rotation:
1. The "Floor" (Value Accep

HD / USD 1D — Bullish Breakout With Follow-Through PotentialHome Depot has transitioned from a prolonged consolidation into a decisive upside expansion, confirmed by a bullish short-term average crossover and multiple upside target interactions. The most recent price action reflects strong acceptance above the short-term mean, signaling a shift from range be

HOME DEPOT About to break its 2-year Support.Home Depot (HD) is on its 1W MA200 (orange trend-line), having arrived here after a violent 2-month sell-off that tested that trend-line for the first time since the April 07 2025 Low.
In fact, this has been the stock's Support since the November 13 2023 break-out (more than 2 years) as it never cl

Home Depot Short Noticing weakness in the XLY and a pattern suggesting HD is about to break to the downside. Going to scalp this with a short bias when the market opens. Will keep tight stops and re-enter with breaks below new support levels. Looking to pick up 4 points and risk .75 pt on the trades, will make 3 att

$HD Pushing Down Before Pulling Away?Yo Yo so, Home Depot was trending up Before crashing down slightly it rejected hard at the confirmation level of 1.272 before falling Aggressively through levels below. Price teased at the 0.272 before reversing back into the retracement/ entry zone @ the 0.382. I can only be Right or Righhhhh. No p

07-2025-12-10-HD-Downtrend-Short-8.5HD:
Short Position with Downtrend
Scorecard: 8.5
S: 352.61
E: 350.12
T: 339.14
Shares: 96.15

HD - Weekly Chart📈 Trade Idea – HD (Weekly Chart)
Long bias on a high-quality setup.
Home Depot is showing early signs of a momentum shift while retesting a major long-term trendline.
Key points:
• Price is rebounding cleanly off the EMA200 weekly, a level that has acted as dynamic support multiple times.
• Mome
See all ideas
Summarizing what the indicators are suggesting.
Neutral
SellBuy
Strong sellStrong buy
Strong sellSellNeutralBuyStrong buy
Neutral
SellBuy
Strong sellStrong buy
Strong sellSellNeutralBuyStrong buy
Neutral
SellBuy
Strong sellStrong buy
Strong sellSellNeutralBuyStrong buy
An aggregate view of professional's ratings.
Neutral
SellBuy
Strong sellStrong buy
Strong sellSellNeutralBuyStrong buy
Neutral
SellBuy
Strong sellStrong buy
Strong sellSellNeutralBuyStrong buy
Neutral
SellBuy
Strong sellStrong buy
Strong sellSellNeutralBuyStrong buy
Displays a symbol's price movements over previous years to identify recurring trends.
HD5834013
Home Depot, Inc. 5.4% 25-JUN-2064Yield to maturity
5.69%
Maturity date
Jun 25, 2064
US437076BX9
Home Depot, Inc. 4.5% 06-DEC-2048Yield to maturity
5.59%
Maturity date
Dec 6, 2048
HD5386726
Home Depot, Inc. 3.625% 15-APR-2052Yield to maturity
5.58%
Maturity date
Apr 15, 2052
US437076CK6
Home Depot, Inc. 2.75% 15-SEP-2051Yield to maturity
5.58%
Maturity date
Sep 15, 2051
HD5834278
Home Depot, Inc. 5.3% 25-JUN-2054Yield to maturity
5.57%
Maturity date
Jun 25, 2054
HD5106413
Home Depot, Inc. 2.375% 15-MAR-2051Yield to maturity
5.56%
Maturity date
Mar 15, 2051
US437076BS0
Home Depot, Inc. 3.9% 15-JUN-2047Yield to maturity
5.56%
Maturity date
Jun 15, 2047
US437076BP60
Home Depot, Inc. 3.5% 15-SEP-2056Yield to maturity
5.56%
Maturity date
Sep 15, 2056
HD5475098
Home Depot, Inc. 4.95% 15-SEP-2052Yield to maturity
5.56%
Maturity date
Sep 15, 2052
HD4971789
Home Depot, Inc. 3.35% 15-APR-2050Yield to maturity
5.55%
Maturity date
Apr 15, 2050
US437076BZ43
Home Depot, Inc. 3.125% 15-DEC-2049Yield to maturity
5.53%
Maturity date
Dec 15, 2049
See all HDI bonds
Frequently Asked Questions
The current price of HDI is 325.35 EUR — it has increased by 0.45% in the past 24 hours. Watch Home Depot, Inc. stock price performance more closely on the chart.
Depending on the exchange, the stock ticker may vary. For instance, on SWB exchange Home Depot, Inc. stocks are traded under the ticker HDI.
HDI stock has risen by 5.43% compared to the previous week, the month change is a 9.09% rise, over the last year Home Depot, Inc. has showed a −18.20% decrease.
We've gathered analysts' opinions on Home Depot, Inc. future price: according to them, HDI price has a max estimate of 381.18 EUR and a min estimate of 279.54 EUR. Watch HDI chart and read a more detailed Home Depot, Inc. stock forecast: see what analysts think of Home Depot, Inc. and suggest that you do with its stocks.
HDI stock is 1.37% volatile and has beta coefficient of 0.68. Track Home Depot, Inc. stock price on the chart and check out the list of the most volatile stocks — is Home Depot, Inc. there?
Today Home Depot, Inc. has the market capitalization of 325.53 B, it has decreased by −4.26% over the last week.
Yes, you can track Home Depot, Inc. financials in yearly and quarterly reports right on TradingView.
Home Depot, Inc. is going to release the next earnings report on Feb 24, 2026. Keep track of upcoming events with our Earnings Calendar.
HDI earnings for the last quarter are 3.24 EUR per share, whereas the estimation was 3.32 EUR resulting in a −2.46% surprise. The estimated earnings for the next quarter are 2.14 EUR per share. See more details about Home Depot, Inc. earnings.
Home Depot, Inc. revenue for the last quarter amounts to 35.84 B EUR, despite the estimated figure of 35.68 B EUR. In the next quarter, revenue is expected to reach 32.19 B EUR.
HDI net income for the last quarter is 3.12 B EUR, while the quarter before that showed 3.99 B EUR of net income which accounts for −21.71% change. Track more Home Depot, Inc. financial stats to get the full picture.
Yes, HDI dividends are paid quarterly. The last dividend per share was 1.98 EUR. As of today, Dividend Yield (TTM)% is 2.39%. Tracking Home Depot, Inc. dividends might help you take more informed decisions.
Home Depot, Inc. dividend yield was 2.18% in 2024, and payout ratio reached 60.36%. The year before the numbers were 2.35% and 55.32% correspondingly. See high-dividend stocks and find more opportunities for your portfolio.
As of Feb 8, 2026, the company has 470.1 K employees. See our rating of the largest employees — is Home Depot, Inc. on this list?
EBITDA measures a company's operating performance, its growth signifies an improvement in the efficiency of a company. Home Depot, Inc. EBITDA is 22.13 B EUR, and current EBITDA margin is 15.82%. See more stats in Home Depot, Inc. financial statements.
Like other stocks, HDI shares are traded on stock exchanges, e.g. Nasdaq, Nyse, Euronext, and the easiest way to buy them is through an online stock broker. To do this, you need to open an account and follow a broker's procedures, then start trading. You can trade Home Depot, Inc. stock right from TradingView charts — choose your broker and connect to your account.
Investing in stocks requires a comprehensive research: you should carefully study all the available data, e.g. company's financials, related news, and its technical analysis. So Home Depot, Inc. technincal analysis shows the buy rating today, and its 1 week rating is buy. Since market conditions are prone to changes, it's worth looking a bit further into the future — according to the 1 month rating Home Depot, Inc. stock shows the buy signal. See more of Home Depot, Inc. technicals for a more comprehensive analysis.
If you're still not sure, try looking for inspiration in our curated watchlists.
If you're still not sure, try looking for inspiration in our curated watchlists.