Tesla Confirmed Distribution Tesla could be in for a mark down in price in the coming weeks looking at this weekly chart.
Three falling peaks has played out before on this ticker, could it play out again?
TL0 trade ideas

TSLA vs NVDATesla's EV Throne: Secure, But Stock Stumbles as AI Spotlight Shines Elsewhere
Tesla, the undisputed king of the electric vehicle (EV) castle, faces a curious predicament. While its Model Y and X reign supreme on the roads, its stock ticker, TSLA, takes a drubbing in the market. The culprit? A spotlight shift towards artificial intelligence (AI), with Nvidia (NVDA) basking in its warm glow.
EV Crown Unequivocally Tesla's: Let's be clear, Tesla's dominance in the EV space is undeniable. With a 70% market share in the US and a global lead, they're miles ahead of the competition. Their innovative technology, sleek designs, and robust charging infrastructure keep them firmly planted on the EV throne.
So Why the TSLA Slump? Enter the AI gold rush. Investors, ever eager for the next big thing, have turned their attention towards the burgeoning field of AI. Nvidia, a leader in AI hardware and software, has become the new golden boy, its stock soaring as investors bet on its potential to revolutionize everything from self-driving cars to healthcare.
The AI Hype vs. Tesla's Reality: While Tesla heavily invests in AI for its autopilot features and future robotaxis, its immediate focus remains on churning out and selling EVs. This, in the face of slowing growth and intense competition in the EV market, makes TSLA a less flashy bet compared to NVDA's AI moonshot potential.
Is the Tesla Downturn Temporary? Not necessarily. The AI gold rush might cool down eventually, and TSLA could regain its luster as investors refocus on the booming EV market. However, Tesla faces challenges beyond the hype cycle. Price cuts due to increased competition, potential production slowdowns, and reliance on charismatic CEO Elon Musk for market sentiment are all factors that could keep TSLA under pressure.
The Verdict: A Tale of Two Titans: This isn't a David-and-Goliath story. Both Tesla and Nvidia are titans in their respective fields. Tesla will likely retain its EV crown for years to come, while Nvidia may well unlock the potential of AI. The market's current fascination with AI simply overshadows Tesla's ongoing success story for now. Investors, however, must remember that both companies hold immense potential, and the tides of market favor can shift quickly. The key is to understand the underlying dynamics and make informed decisions based on your risk appetite and investment horizon.
So, while Tesla navigates the AI hype storm, its throne in the EV kingdom remains secure. But for investors, the choice between the EV king and the AI champion depends on their own vision of the future, and their tolerance for the ever-shifting winds of market sentiment.
Alternative charts:

TSLA was obviously going to continue with that BEAR pulldownNot only does the technical show it but also their financial statements. #TSLA

H & S fails, Bullish flag formation Head & Shoulder formation has failed. Next up is Bullish flag formation, before the show goes on UP!

Unlocking Tesla's Potentials: A Deep Dive into Elliott WavesTesla's chart remains intriguing, particularly on the two-hour time frame. It's evident that we've experienced a Wave 1 structure after hitting the low at $194. Following that, a Wave A unfolded with a three-wave structure (abc), followed by another B with an overshooting flat pattern (abc). My current belief is that we're still in the process of forming Wave C /Wave (2). This wave should find support between 50% and 78.6%, and anything below could indicate a return to $194. I've placed my stop-loss at 50%, aiming for at least a short-term rise to $300, approximately 34%.

TSLA is 2nd most oversold everThere was a plethora of PUT SELLING on NASDAQ:TSLA yesterday and the sellers must not be happy today. OUCH Most of the contracts were at least 6 months plus so they have time unless #Tesla stock gets put to them.
Weekly shows selling for last few weeks & the downtrend stopping all advances.
(not shown here, pls see profile for more info)
Daily, it's @ 2nd most oversold & the 1st was last year. It was not the norm until last year for Tesla to get this oversold.

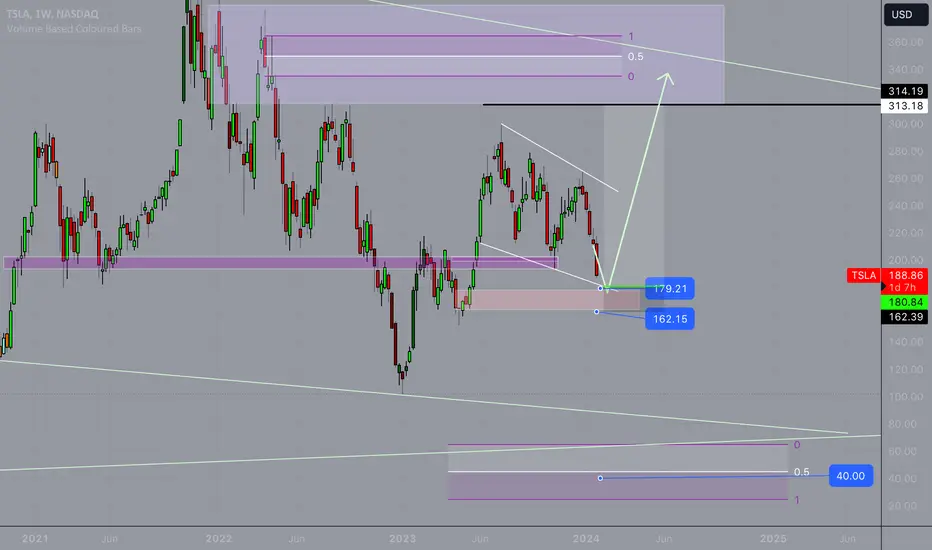
Tesla Long - 4.5R There is significant divergence with the NASDAQ and Tesla.
NASDAQ has been ripping higher while Tesla has been declining.
Due to the bullish technicals on Tesla I believe this is a bullish divergence and will soon see Tesla reverse once it reaches the pink zone which starts at around 180.
Your stop loss can go at 151 for a conservative option, or if going more aggressive at 162 which will increase the risk to reward ratio from 4.5R to 7R.
Target is 313.
TSLA Earnings After HoursTSLA reports earnings today after hours. QQQ is pretty overbought, but TSLA has been hammered down lately. Really interested to see what they do. I'm technically long shares, but not getting overly optimistic. Gapping down seems to be the crowded trade at the moment. We'll see after the bell!

Tesla 2023 Review and Outlook2023 Review
In 2023, Tesla delivered over 1.2 million Model Y’s establishing it as the best-selling vehicle globally, regardless of type, signaling a remarkable shift in the automotive landscape. Despite initial skepticism about the viability of electric vehicles (EVs), this success has proven otherwise.
Maintaining a robust free cash flow of $4.4 billion throughout 2023, they strategically directed significant resources towards future growth projects, resulting in record-high capital expenditures and research and development (R&D) expenses. They remain committed to innovation and expansion.
Energy storage deployments soared to 14.7 gigawatt-hours (GWh) in 2023, more than doubling the previous year's figures. Simultaneously, Energy Generation and Storage business witnessed a nearly fourfold increase in profits. The Services & Other business also experienced a substantial transformation, turning a $500 million loss in 2019 into a $500 million profit by 2023.
In the final quarter, the cost of goods sold per vehicle exhibited a sequential decline, a testament to the company's dedication to enhancing efficiency. Looking ahead to 2024, Tesla’s focus remains on scaling production, investing in future growth, and uncovering additional cost-saving measures.
In a groundbreaking development, December saw the rollout of Version 12 of Full Self-Driving Beta, a system trained on data from a vast fleet of over a million vehicles. This advanced AI-driven system influences various vehicle controls, such as steering wheel, pedals, and indicators, without relying on hard-coded driving behaviors. V12 signifies a significant leap forward in the journey toward achieving full autonomy.
The company’s sights are set on introducing the next generation platform expeditiously, with plans to commence production at Gigafactory Texas. This revolutionary platform is poised to redefine the manufacturing process for vehicles, ushering in a new era of automotive innovation.
Outlook
Volume: The company currently finds itself between two substantial growth phases. The first wave commenced with the global expansion of the Model 3/Y platform, and they anticipate the next surge to be triggered by the worldwide expansion of the next-generation vehicle platform. In 2024, the growth rate of their vehicle volume may experience a notable decrease compared to 2023, primarily due to the focus of the company on the launch of the next-generation vehicle at Gigafactory Texas. During this period, the growth rate of deployments and revenue in the Energy Storage business will surpass that of the Automotive business they announced
Cash: They maintain ample liquidity to support the product roadmap, long-term capacity expansion plans, and other financial obligations.
Profit: The company persists in implementing innovations to reduce manufacturing and operational costs, while foreseeing a shift in the profit landscape. Over time, they anticipate that profits from hardware-related aspects will be complemented by an acceleration in AI, software, and fleet-based profits.
Product: The ramp-up of Cybertruck production and deliveries is slated to progress steadily throughout the year. Concurrently, they continue to make significant strides in the development of our next-generation platform.

$180 possible by Friday (From Historical data) $TSLABoth Q2 and Q3 2023 earnings reports had negative news for investors, and both had a subsequent drop in their stock value:
Post Q2 earnings report in July: Stock dropped by 12%.
Post Q3 earnings report in October: Stock dropped by 15%
If the stock doesn't hold support at $200, which is currently resistance as of the PM, we may see Tesla hit $190 as the next support tomorrow, following $180 with lower probability if $190 doesn't hold.

The Share Price of TSLA Sharply DeclinedThe Share Price of TSLA Sharply Declined After the Release of the Report
Following the publication of Tesla's (ticker TSLA) financial results for the fourth quarter of 2023, the company's stock price dropped. The TSLA share price in pre-market trading today is around $195, compared to yesterday's closing price of over $207 (approximately -6%).
Reasons for disappointment:
→ Earnings per share fell short of expectations at $0.71, compared to the Wall Street consensus of $0.73 per share.
→ Quarterly revenue amounted to $25.167 billion, which also fell below the expected $25.640 billion.
→ Additionally, a decrease in profitability was reported, partly attributed to issues with the introduction of the Cybertruck.
→ Tesla also provided a cautious outlook for 2024, warning that the growth rate in car production volumes could be "significantly lower" than in 2023. This is primarily due to the focus on launching the next-generation vehicle at the Gigafactory in Texas.
In October 2023, analysing the TSLA stock chart, it was noted that the price broke below the ascending trend. How does the situation look today?
→ The TSLA price failed to return to the ascending trend (shown in blue) of 2023.
→ The price continues to evolve within the descending trend (shown in red), the contours of which were noticeable as early as October.
After the release of this news, a bearish gap is likely to form at today's opening, and one should be prepared for:
→ Breaking the psychological level of $200 per share – this level may switch its role from support (noticeable in the price action on October 30-31) to resistance.
→ The TSLA share price dropping to the lower half of the descending channel. The median line of this channel will act as resistance.
→ Bears attempting to extend their success to bring the price down to the lower boundary of the channel (around $180).
Investor issues with TSLA stock have been evident for some time, as the price has been noticeably weaker than stock indices reaching peaks in December 2023 - January 2024. If the fundamental backdrop continues to be negative, it is possible that the red descending channel will shape the trajectory of TSLA's price in the first half of 2024.
This article represents the opinion of the Companies operating under the FXOpen brand only. It is not to be construed as an offer, solicitation, or recommendation with respect to products and services provided by the Companies operating under the FXOpen brand, nor is it to be considered financial advice.

Another year to wait for the upTesla looks to release their next gen Vehicle 2nd half 2025 and chart shows good timing for the next upside but sideways until then

Tesla : After the rain comes sunshineTesla had a nice rally from 100 to 300 in an impulsive wave up after an ABC corrective wave from the all time high. Since hitting 300 price has moved down in a corrective wave lower. This move is a wave 2 and could go to 180 ( 76.4% of wave a of 2 + 61.8% retracement of wave 1 ) or even to 150 ( equal legs inside wave 2 + 76.4% retracement of wave 2 ).
Line in the sand for this wave 2 is the 101.81 low, anything below this invalidates this count.
Look for price to move higher in an impulsive wave as wave 3 will start after hitting the wave 2 low. Eventually price will break the trendline from the all time high, move above 300 again and hunt for the all time high.
Alternative count would have price in a wave C instead of wave 3. This would still break 300 but will turn around down before hitting all time highs. This would also mean that price will break the 100 low, or ...more rain ahead...

TSLA is ready for the biggest move in its historyTSLA will soon have the biggest move in its history on the stock market. It is coiling in a 2-year-old symmetrical triangle, and there is no more room for coiling to continue. It is at the end of the top of the triangle, and the move is imminent.
Both RSI and MACD are in the middle and don't show anything about where the move could be.
For bulls, there is a slight chance for a breakout because the symmetrical triangle is a continuation pattern, and if we watch it from the start, this symmetrical triangle is forming at higher levels. I would like to see a break on the weekly chart above the blue upper dotted line before entering a longer position. This line represents a minor trend line and connects shadows, while the main trend line connects the closing price. The move should be on a huge candle with volume. Major resistance at ATH.
For bears, I would like to see a close below the blue dotted line and also below the 200-week MA. There is more chance for bulls as support is very strong. But if bears manage to break down, and if the break below BigRed, the drop will be crazy and fast, and we will visit 100 in several weeks. Major support at 100
Make or break will be within weeks or days.

TSLA Bearish outlook but glimpse of hopeTSLA our love our heart is now confirming a long running bearish trend since it reached 300
TSLA did a fake breakout at 252 levels which then proceeded towards a bearish movement and now we can see it has officially reached 195 levels
Looking at the last 3 RSI oversold touches we can see it was quickly followed up by a bull rally
BULL CASE or glimpse of hope!!!
195 is going to be a double bottom and previous very strong support and RSI reaching the same levels like it was at 195 before i,e 30 OCT 2023 was also after Earnings dump
So if history repeats and we are lucky it can reverse from 195 levels , From 195 upwards there are very strong resistance levels i.e 200, 208 , 218 and 227 . if we reverse then we should enter after bullish reversal confirmation and be happy with small profits :)
BEAR CASE
We continue falling down from 195 levels and then next strong support is at 175 then 150 . AFter 150 its the Dark era of TSLA which I hope doesn't come
Wait and see game on!!!!

The Fall of TeslaI bought a few put contracts of TSLA early this week - and here were my reasonings:
On the technical side, RSI and MACD are bearish of late. In the past during the lat 4 quarters of earnigs, TSLA went down three out of four times when the fundamentals were a lot better. The fundamentals are more challenging no with competition from China.TSLA is also not prirotizing leasing (see today's WSJ).
Lastly, they have underestimated the challenge of large scale manufacturing and integrating that AI. I have been an engineer all my life. Large-scale manufacturing is not easy. It takes years.
I am bearish long-term on TSLA - unless they can show that they have theor house in order.

$TSLA Double Bottom Day TradeNASDAQ:TSLA Double Bottom Day Trade
The technical analysis reveals the presence of a double bottom pattern in the market. This pattern suggests a potential trend reversal, indicating that after a downtrend, the security or asset has reached a low price twice with a moderate increase in price in between. Traders often consider the double bottom as a bullish signal, anticipating a possible upward movement in the future.

Avoid Tesla-Jan 24 2024This green box is the origin of this rally, which is also a poor Dz, but again, it's the origin, and below it is another support. It is good enough to ruin short sellers' gain .


Shaky long-term trading for Tesla (Triple top + dip? )Since Oct. '21, Tesla has been trading along this channel. Some patterns emerge that we can point out:
After hitting the top of the channel three times from Oct. 21 to Apr. 22, it was followed by a dip to the bottom of the channel.
To a lesser degree, rising to about .75 the height of the channel on July 22 and hitting that region 3 times, this was also followed by a dip to the bottom of the channel.
We currently have the same pattern emerging since July '23, with the price of TSLA dipping to below $200. This cycle is interesting because it is bouncing off the midline instead of the bottom of the channel.
The next few days are going to be crucial for the stock:
Bull case: If the stock can consolidate strongly along the $180-200, we may be able to break out of the channel to the upside.
Bear case: If the stock fails to consolidate strongly along the $180-200 range, we may see a dip to $120-160.
This will strongly depend on investor sentiment in the company, which currently isn't looking strong. A lot can happen in the next few weeks to turn that around, such as further advancements of AI for Tesla's autopilot.

Another spike would setup a nice head and shoulders in TSLA. Some charts just chart up themselves. Here if we see a spike we'll get a head and shoulders completing around the 76 retracement.
Very good confluence of short signals. Would love to fade a spike here.

TSLA after the earningsTSLA is in its downtrend channel but below the main support rising channel, which was tested several times from below - bearish action.
We were looking for an expected volatility move after the earnings of +/-7%. So far the price is down over 7% and still sliding.
Looking for a gap fill next at minimum, which sits at 193.17

Tesla Triangle Bottoming Out
NASDAQ:TSLA currently has two major confluences that I've been watching develop over the last few weeks.
Firstly, coming off the 6 month high of mid July, Tesla has retraced to the Fibonacci 0.618.
Secondly, A classic triangle is now clear.
Triangles break out either to the top or the bottom. However, there are multiple confluences that are pushing me towards a (short term) Long position for a breakout:
#1: The Psychological. It's been very trendy to short Tesla as of late. According to CNN , short sellers lost 12.2b in liquidity shorting Tesla last year. I suspect retail and algos are looking for a buy opportunity.
#2: Long Term Technicals. There are only so many people on this planet that can afford high quality electric vehicles. But, the Model 3 and Model Y is now within reach of most consumers. However, electric vehicles are starting to show some previously unknown issues with a mass market. CBS News reports that Tesla owners can expect to find a 30% reduction in range in temperatures below freezing. For many Americans, this can be hard to swallow, especially for those commuting 50-60 miles a day for work.
#3: Adam Jonas. Adam Jonas cut his bullish price target from 380 to 345 this morning citing multiple factors including, "Global EV momentum is stalling. The market is oversupplied (and not enough) demand."
#4. Price Action. I'll go into this a bit more below with my expectations.
I see two scenarios playing out long term, but first lets set the baseline:
618 fibonacci is extremely stable, and it near perfectly lines up with the price action triangle. Tesla earnings are two days. I suspect we'll see intraday tomorrow as people anticipate the report but nothing drastic. Cybertruck has been delivering for the past few months and I expect we'll see a Christmas sales bump missed in the October report as prices continue to drop.
If the earnings report is positive (It most likely is) We will absolutely see a retracement to the 0.5. As there is (currently) little price action to support a resistance of the 0.5, it's possible that it could push past and there could be a retest towards late November through early December trade chop.
Anything beyond that would be ultra speculative, but two likely scenarios will play out after the move up:
First and what I believe to be most likely, We'll see another retracement to 618 and a bottom side triangle breakout. Fibonacci velocity resistance on the same high & low shows weak support.
Combine this negative sentiment towards luxury goods and vehicles in general ( highest delinquency in 30 years ) and we very well could setup for a false or full on breakout of this triangle.
Second and personally less likely, we setup for a mini bull flag as price action consolidates and breakout at the top.
Any way it swings will be interesting. I'll be keeping an eye on other confluences that appear as the retracement plays out to make a more accurate guestimate.
Cheers
-T
