SHORT SETUP: U.S. Bancorp (USB)Hunters, keep an eye on the banking sector! 🏦 While the crowd is celebrating earnings, we see an opportunity on the opposite side of the market.
U.S. Bancorp stock ( NYSE:USB ) is trading in a strong resistance zone around the $56 - $57 level (yearly highs). Despite positive news from Q4 earnings,
U.S. Bancorp
No trades
Next report date
—
Report period
—
EPS estimate
—
Revenue estimate
—
3.93 EUR
6.45 B EUR
36.49 B EUR
1.55 B
About U.S. Bancorp
Sector
Industry
CEO
Gunjan Kedia
Website
Headquarters
Minneapolis
Founded
1929
IPO date
May 7, 1984
Identifiers
3
ISIN US9029733048
U.S. Bancorp operates as a bank holding company, which offers financial services including lending and depository services, cash management, foreign exchange and trust and investment management. The firm also offers mortgage, refinance, auto, boat and RV loans, credit lines, credit card services, merchant, bank, checking and savings accounts, debit cards, online and mobile banking, ATM processing, mortgage banking, insurance, brokerage and leasing services. The company was founded on April 2, 1929, and is headquartered in Minneapolis, MN.
Related stocks

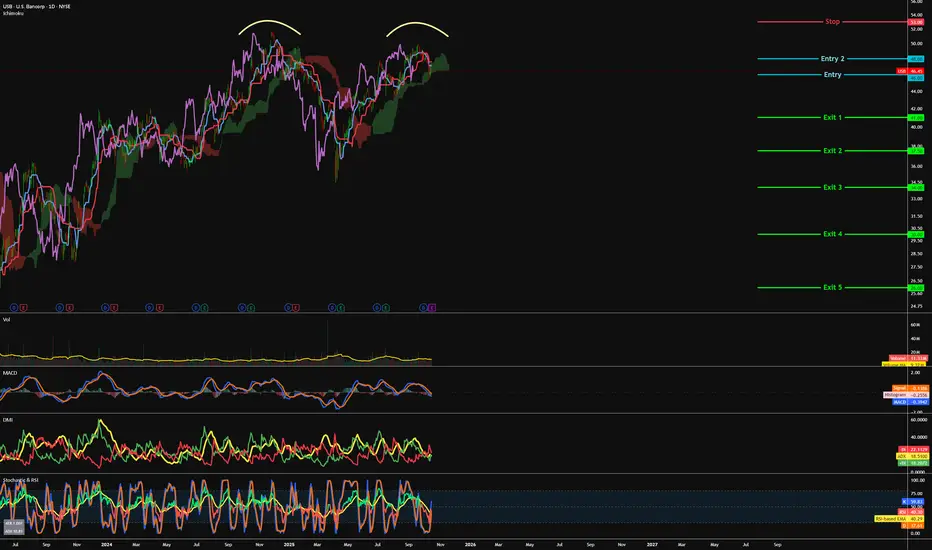
USB - Double top, on the way down.=======
Volume
=======
-neutral
==========
Price Action
==========
- Double top
=================
Technical Indicators
=================
- Ichimoku
>>> price within cloud
>>> Green kumo thinning
>>> Tenken + Chiku - within cloud and sloping downwards
>>> Kijun - within cloud and sloping down
USB | This Regional Bank May POP Higher ! | LONGU.S. Bancorp operates as a bank holding company, which offers financial services including lending and depository services, cash management, foreign exchange and trust and investment management. The firm also offers mortgage, refinance, auto, boat and RV loans, credit lines, credit card services, me

Friday Market Condition AnalysisThis is a weekly analysis of Market Conditions based on my CMT theories. There are 6 Primary Market Conditions. Each is unique and easy to identify once you understand the theory behind it. Who is in control of price.
What technical patterns are prevalent and reliable.
How Price will behave: Resist

$USB OTE: 47.5, TP:50. Let see at 4H TF how is perform.
using Hullma, Price Action and Gamma & Vanna mapping.
Looks promising
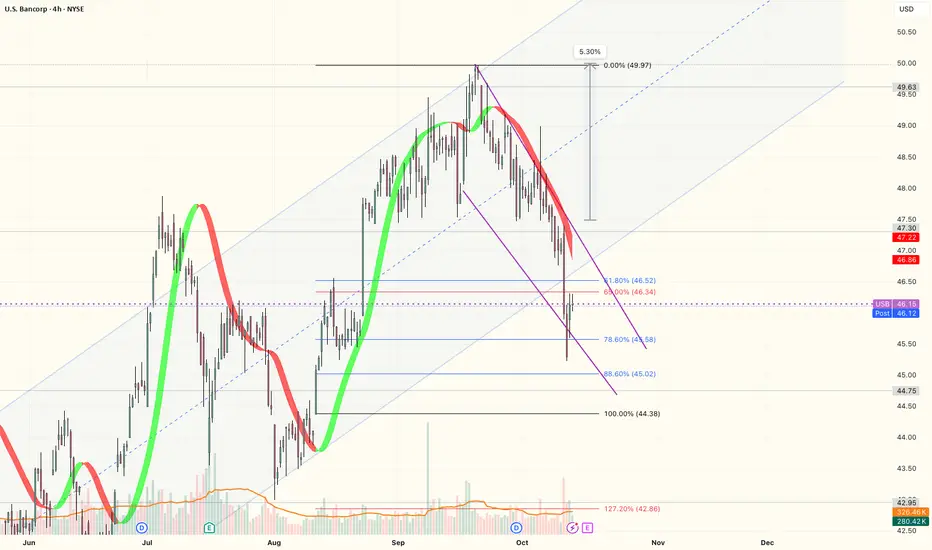
US Bancorp Stock Chart Fibonacci Analysis 081425Trading Idea
1) Find a FIBO slingshot
2) Check FIBO 61.80% level
3) Entry Point > 44.5/61.80%
Chart time frame:B
A) 15 min(1W-3M)
B) 1 hr(3M-6M)
C) 4 hr(6M-1year)
D) 1 day(1-3years)
Stock progress:C
A) Keep rising over 61.80% resistance
B) 61.80% resistance
C) 61.80% support
D) Hit the bottom
E
Waiting for quick correction, short term call options testing Testing medium- to high-risk short-term strategies, taking advantage of overselling and a breakout of the downtrend ceiling. We're currently waiting for a candle with volume for confirmation. We can enter a call with a strike price of 17.60 OM.

Trading US BancorpUSB's stock has created an almost perfect head and shoulders pattern, clearly marking the support line in red and recently breaking it, with a pullback included.
This leads us to believe that with the recent CEO changes, the questionable acquisition of the Southeast bank, and some fee issues, th

USB: False breakdown and a test of 200SMAThings that I like
1. Test at Weekly 200SMA. This MA has been key, acted as resistance prior, and now we are retesting it as support.
2. False breakdown
3. Tailwind from regional bank sector and high interest rates
4. RSI on weekly staying above 50
5. RSI on daily showing continued bullish diverg

U.S. Bancorp Buy opportunity setting upU.S. Bancorp is a financial service holding company. The Company’s major lines of business are Wealth, Corporate, Commercial and Institutional Banking, Consumer and Business Banking, Payment Services, and Treasury and Corporate Support. The Company provides a range of financial services, including l

See all ideas
Summarizing what the indicators are suggesting.
Neutral
SellBuy
Strong sellStrong buy
Strong sellSellNeutralBuyStrong buy
Neutral
SellBuy
Strong sellStrong buy
Strong sellSellNeutralBuyStrong buy
Neutral
SellBuy
Strong sellStrong buy
Strong sellSellNeutralBuyStrong buy
An aggregate view of professional's ratings.
Neutral
SellBuy
Strong sellStrong buy
Strong sellSellNeutralBuyStrong buy
Neutral
SellBuy
Strong sellStrong buy
Strong sellSellNeutralBuyStrong buy
Neutral
SellBuy
Strong sellStrong buy
Strong sellSellNeutralBuyStrong buy
Displays a symbol's price movements over previous years to identify recurring trends.
USB.JA
U.S. Bancorp 7.5% 01-JUN-2026Yield to maturity
7.69%
Maturity date
Jun 1, 2026
USB6096747
U.S. Bancorp 6.25% 13-JUN-2045Yield to maturity
6.12%
Maturity date
Jun 13, 2045
USB6033280
U.S. Bancorp 6.0% 24-MAR-2045Yield to maturity
5.99%
Maturity date
Mar 24, 2045
USB6064705
U.S. Bancorp 6.0% 30-APR-2045Yield to maturity
5.99%
Maturity date
Apr 30, 2045
USB6096751
U.S. Bancorp 6.0% 13-JUN-2045Yield to maturity
5.99%
Maturity date
Jun 13, 2045
USB6008756
U.S. Bancorp 6.0% 28-FEB-2045Yield to maturity
5.96%
Maturity date
Feb 28, 2045
USB6096746
U.S. Bancorp 6.0% 13-JUN-2045Yield to maturity
5.96%
Maturity date
Jun 13, 2045
USB6096748
U.S. Bancorp 6.0% 13-JUN-2037Yield to maturity
5.95%
Maturity date
Jun 13, 2037
USB6010612
U.S. Bancorp 6.0% 28-FEB-2035Yield to maturity
5.95%
Maturity date
Feb 28, 2035
USB6141549
U.S. Bancorp 6.0% 07-AUG-2045Yield to maturity
5.95%
Maturity date
Aug 7, 2045
USB6132649
U.S. Bancorp 6.0% 30-JUL-2045Yield to maturity
5.94%
Maturity date
Jul 30, 2045
See all UB5 bonds
Frequently Asked Questions
The current price of UB5 is 50.88 EUR — it has increased by 0.32% in the past 24 hours. Watch U.S. Bancorp stock price performance more closely on the chart.
Depending on the exchange, the stock ticker may vary. For instance, on SWB exchange U.S. Bancorp stocks are traded under the ticker UB5.
UB5 stock has risen by 5.72% compared to the previous week, the month change is a 7.81% rise, over the last year U.S. Bancorp has showed a 11.57% increase.
We've gathered analysts' opinions on U.S. Bancorp future price: according to them, UB5 price has a max estimate of 65.18 EUR and a min estimate of 49.94 EUR. Watch UB5 chart and read a more detailed U.S. Bancorp stock forecast: see what analysts think of U.S. Bancorp and suggest that you do with its stocks.
UB5 stock is 1.97% volatile and has beta coefficient of 1.19. Track U.S. Bancorp stock price on the chart and check out the list of the most volatile stocks — is U.S. Bancorp there?
Today U.S. Bancorp has the market capitalization of 78.87 B, it has increased by 0.35% over the last week.
Yes, you can track U.S. Bancorp financials in yearly and quarterly reports right on TradingView.
U.S. Bancorp is going to release the next earnings report on Apr 16, 2026. Keep track of upcoming events with our Earnings Calendar.
UB5 earnings for the last quarter are 1.07 EUR per share, whereas the estimation was 1.01 EUR resulting in a 5.99% surprise. The estimated earnings for the next quarter are 0.95 EUR per share. See more details about U.S. Bancorp earnings.
U.S. Bancorp revenue for the last quarter amounts to 6.27 B EUR, despite the estimated figure of 6.23 B EUR. In the next quarter, revenue is expected to reach 6.10 B EUR.
UB5 net income for the last quarter is 1.74 B EUR, while the quarter before that showed 1.70 B EUR of net income which accounts for 2.67% change. Track more U.S. Bancorp financial stats to get the full picture.
Yes, UB5 dividends are paid quarterly. The last dividend per share was 0.44 EUR. As of today, Dividend Yield (TTM)% is 3.38%. Tracking U.S. Bancorp dividends might help you take more informed decisions.
U.S. Bancorp dividend yield was 3.82% in 2025, and payout ratio reached 44.18%. The year before the numbers were 4.14% and 52.31% correspondingly. See high-dividend stocks and find more opportunities for your portfolio.
As of Feb 11, 2026, the company has 70 K employees. See our rating of the largest employees — is U.S. Bancorp on this list?
Like other stocks, UB5 shares are traded on stock exchanges, e.g. Nasdaq, Nyse, Euronext, and the easiest way to buy them is through an online stock broker. To do this, you need to open an account and follow a broker's procedures, then start trading. You can trade U.S. Bancorp stock right from TradingView charts — choose your broker and connect to your account.
Investing in stocks requires a comprehensive research: you should carefully study all the available data, e.g. company's financials, related news, and its technical analysis. So U.S. Bancorp technincal analysis shows the buy rating today, and its 1 week rating is buy. Since market conditions are prone to changes, it's worth looking a bit further into the future — according to the 1 month rating U.S. Bancorp stock shows the strong buy signal. See more of U.S. Bancorp technicals for a more comprehensive analysis.
If you're still not sure, try looking for inspiration in our curated watchlists.
If you're still not sure, try looking for inspiration in our curated watchlists.