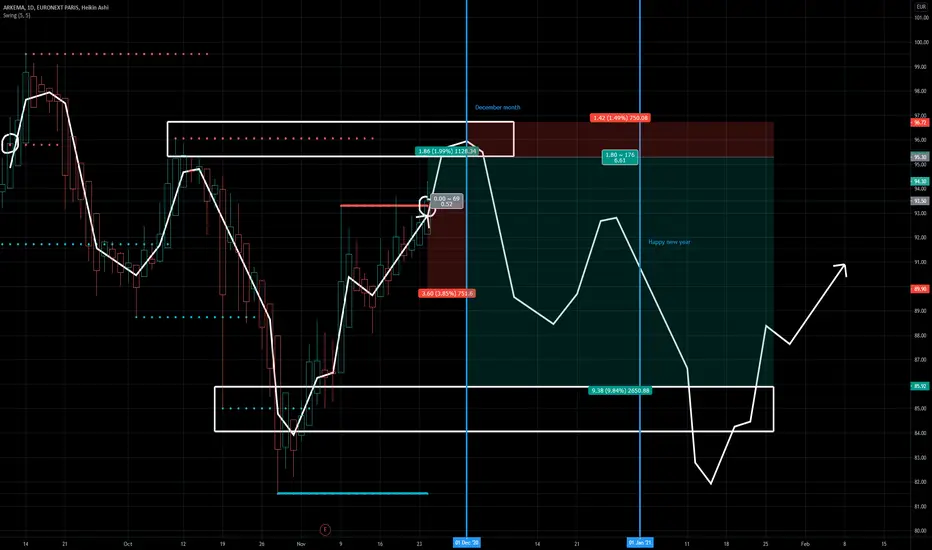
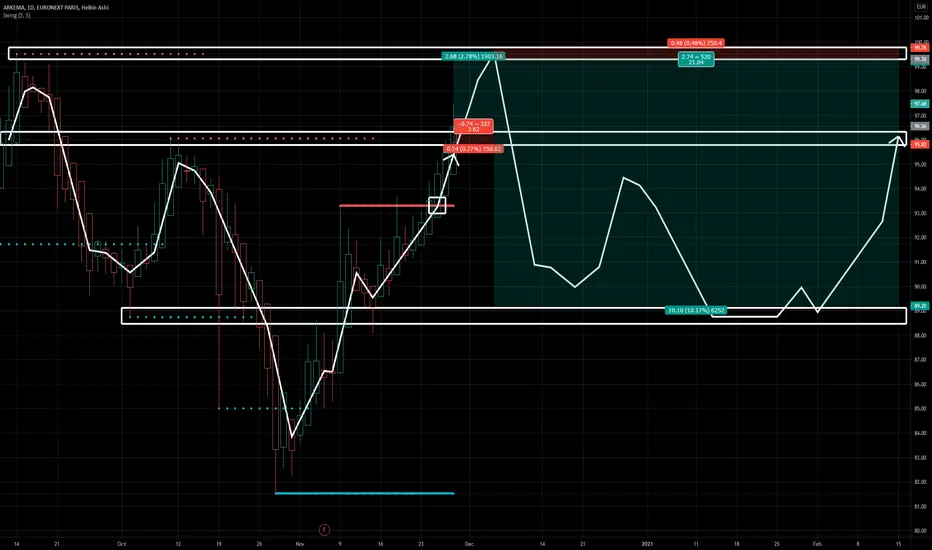
ARKEMA France is on the runGood signs for the future of this company. Top management - top strategy - top results - out performer.
Next report date
Report period
Q1 2024
EPS estimate
1.73EUR
Revenue estimate
2.41 BEUR
5.38EUR
402.00 MEUR
9.51 BEUR
61.63 M
About ARKEMA
Sector
CEO
Thierry le Hénaff
Headquarters
Colombes
Website
Employees (FY)
20.95 K
Founded
2002
ISIN
FR0010313833
FIGI
BBG000PLL207
Arkema SA engages in manufacturing and supplying chemical products. It operates through the following segments: Adhesive Solutions, Advanced Materials, Coating Solutions, Intermediates, and Corporate. The Adhesive Solutions segment supplies technologies used in building activities for businesses and individuals, including sealants, tile and flooring adhesives and waterproofing systems, and technologies. The Advanced Materials segment offers innovative solutions with high added value to meet the major challenges of sustainable development, including lightweighting, new energies, access to water, bio-based products and recycling. The Coating Solutions segment focuses on the broad range of innovative products for decorative paints, industrial coatings and adhesives, and provides solutions for applications in the paper industry, superabsorbent, and water treatment. The Intermediates segment holds positions concerning competitive global product lines used in several industrial sectors such as construction, production of cold, the automotive industry, coatings and water treatment. The company was founded on January 31, 2003 and is headquartered in Colombes, France.

Trade directly on the supercharts through our supported, fully-verified and user-reviewed brokers.


Frequently Asked Questions
The current price of V1S is 97.55 EUR — it has increased by 0.15% in the past 24 hours.
Depending on the exchange, the stock ticker may vary. For instance, on SWB exchange ARKEMA S.A. stocks are traded under the ticker V1S.
ARKEMA S.A. is going to release the next earnings report on May 7, 2024. Keep track of upcoming events with our Earnings Calendar.
V1S stock is 0.77% volatile and has beta coefficient of 0.97. Check out the list of the most volatile stocks — is ARKEMA S.A. there?
V1S earnings for the last quarter are 2.36 EUR per share, whereas the estimation was 2.27 EUR resulting in a 3.89% surprise. The estimated earnings for the next quarter are 1.68 EUR per share. See more details about ARKEMA S.A. earnings.
ARKEMA S.A. revenue for the last quarter amounts to 2.33 B EUR despite the estimated figure of 2.33 B EUR. In the next quarter revenue is expected to reach 2.18 B EUR.
Yes, you can track ARKEMA S.A. financials in yearly and quarterly reports right on TradingView.
V1S stock has fallen by 0.41% compared to the previous week, the month change is a 0.07% rise, over the last year ARKEMA S.A. has showed a 12.28% increase.
V1S net income for the last quarter is 4.00 M EUR, while the quarter before that showed 114.00 M EUR of net income which accounts for −96.49% change. Track more ARKEMA S.A. financial stats to get the full picture.
Today ARKEMA S.A. has the market capitalization of 7.26 B, it has increased by 2.30% over the last week.
Yes, V1S dividends are paid annually. The last dividend per share was 3.40 EUR. As of today, Dividend Yield (TTM)% is 3.50%. Tracking ARKEMA S.A. dividends might help you take more informed decisions.
ARKEMA S.A. dividend yield was 3.40% in 2023, and payout ratio reached 64.99%. The year before the numbers were 4.05% and 26.55% correspondingly. See high-dividend stocks and find more opportunities for your portfolio.
Like other stocks, V1S shares are traded on stock exchanges, e.g. Nasdaq, Nyse, Euronext, and the easiest way to buy them is through an online stock broker. To do this, you need to open an account and follow a broker's procedures, then start trading. You can trade ARKEMA S.A. stock right from TradingView charts — choose your broker and connect to your account.
As of May 2, 2024, the company has 20.95 K employees. See our rating of the largest employees — is ARKEMA S.A. on this list?
Investing in stocks requires a comprehensive research: you should carefully study all the available data, e.g. company's financials, related news, and its technical analysis. So ARKEMA S.A. technincal analysis shows the buy rating today, and its 1 week rating is buy. Since market conditions are prone to changes, it's worth looking a bit further into the future — according to the 1 month rating ARKEMA S.A. stock shows the buy signal. See more of ARKEMA S.A. technicals for a more comprehensive analysis.
If you're still not sure, try looking for inspiration in our curated watchlists.
If you're still not sure, try looking for inspiration in our curated watchlists.
We've gathered analysts' opinions on ARKEMA S.A. future price: according to them, V1S price has a max estimate of 127.00 EUR and a min estimate of 90.00 EUR. Read a more detailed ARKEMA S.A. forecast: see what analysts think of ARKEMA S.A. and suggest that you do with its stocks.
EBITDA measures a company's operating performance, its growth signifies an improvement in the efficiency of a company. ARKEMA S.A. EBITDA is 1.50 B EUR, and current EBITDA margin is 15.78%. See more stats in ARKEMA S.A. financial statements.