Day 27 — Trading Only S&P Futures | 20pt Win & Bottom CatchWelcome to Day 27 of Trading Only S&P Futures!
Started the day red due to overnight trades, but once the session opened, everything lined up perfectly. I waited for resistance after spotting multiple X7 sell signals, shorted the top, and caught a 20-point move down to MOB. From there, I flipped long, and later caught the market bottom with the help of Bia’s analysis.
The result? A smooth +385 day — clean reads, clean execution.
📰 News Highlights
S&P 500, NASDAQ eke out record closing highs after tame PPI inflation data
🔑 Key Levels for Tomorrow
Above 6515 = Remain Bullish
Below 6500 = Flip Bearish
SPF1! trade ideas

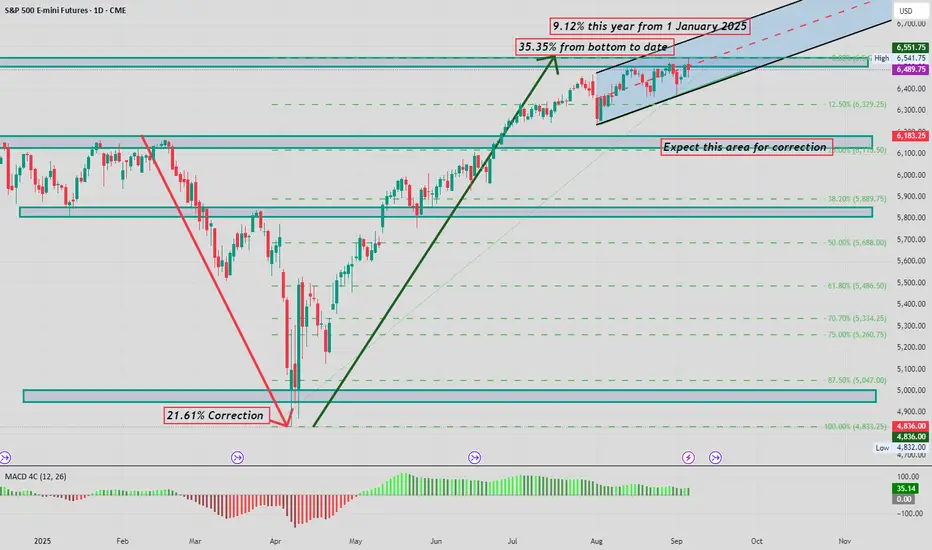
S&P moves this year and potential correction target i Have mapped out the moves we have had this year and show key areas and a potential correction pullback area.
Stock Index: The AI Bubble That Will Burst!ES
S&P 500 futures finishes up 0.23% as economic slowdown worries cloud rate-cut optimism. From a technical perspective, this week marks the third consecutive where ES has been trading inside of 11 Aug 25 bullish spinning top candle indicating weakness of bulls after reaching uncharted territory of $6,541.75 all-time highs.
Such signs point to a short-term retracement down into discount arrays but I am not here trying to guess the top. If it does occur, $6,355.00 is an area of interest but on an overall basis, I want to be neutral until Sunday’s opening price / opening gap.
NQ
Nasdaq follows with a 0.93% gain but with the same issue of price trading within a range, in this case, since the 4th Aug 25 weekly bullish marabozu was printed, I would not want to put my money on a continued run as of yet. Preeing short-term retracements with a discount array @ $22,781.75 is being watched closely and for the time being, I want to be neutral
YM
Dow Jones closes -0.37% lower this week with the intermediate highs of $45,887 still in tact. Will the monthly buyside liquidity pool be used to suck in unexpected bull traders before repricing to HTF discount arrays?
If I am to see a decline in the 3 stock index pairs, YM will be the pair to lookout for as the front-running market.

ES - Week 37a small 1hr distribution trend is forming and price is lingering under last months high.
lets see which levels form this week and practice procedural analysis.
What is on the chart is comparative analysis. Comparing what has happened in the past with current price structures.
T.A - Technical Analysis in 4 parts
M.A. - Mental Analysis
C.A. - Comparative Analysis
R.A - Risk Analysis
P.A. - Procedural Analysis

ES (S&P500) - Analyses - Breakout or Breakdown Plan (Sep 9)S&P 500 E-mini (ES) keeps ranging inside 6,490–6,505, with repeated taps of 6,516 above and 6,490–6,496 below. Tomorrow I’m stalking a box resolution during the AM session, then a second chance in the PM window.
Key Zones
Resistance: 6,505–6,516 (NYPM/NYAM lid). Above it: 6,541.25 (PDH) → 6,547.75 (IBH).
Support: 6,495–6,490 (NYAM/NYPM floor). Below it: 6,481.0 → 6,471.5 (hard pools).
Range to watch: 6,490–6,505 (decision box).
Game Plan (structure-first)
LONG (breakout-acceptance)
1. 5-minute displacement close > 6,505–6,516.
2. Retest 6,501–6,503 (OB/FVG/OTE) and hold.
3. Entry on confirm; Targets: TP1 6,541.25, TP2 6,547.75, TP3 6,555+.
4. Invalidation: any 5-minute body back ≤ 6,500 after breakout.
SHORT (breakdown-acceptance)
1. 5-minute displacement close < ~6,496.
2. Retest 6,498–6,500 (failed reclaim) and roll.
3. Entry on confirm; Targets: TP1 6,481.0, TP2 6,471.5, TP3 6,464–6,465.
4. Invalidation: any 5-minute body ≥ 6,500 after fill.
Timing windows
Primary: 09:30–11:30 ET and 13:30–15:30 ET (trade management only in between).
We are currently consolidating below 6,516, with a clear liquidity ladder leading to PDH 6,541.25 if the movement is accepted. If it fails, we have stacked support levels around 6,481 and 6,471 that typically attract price action once 6,496 breaks down.
Please confirm with ES and NQ: we want both indices to move in sync (no bearish signs of market tension on longs, and no bullish signs of market tension on shorts).
What could affect ES tomorrow?
NFIB Small Business Optimism (Aug): 6:00 AM ET.
API crude inventories (for CL correlation): Tuesday around 4:30 PM ET.
(For Wednesday's context: EIA petroleum report at 10:30 AM ET.)

Follow-Up: Non-Farm Moves from FridayHi All,
Following up on the range (size of the move) after non-farm on Friday to see how close our range expectation estimates were (see the earlier video post linked here for that).
The actual number came in pretty poor and worse than expected at 22k (vs 75k expected).
The move on the Non-farm release itself was actually quite muted with roughly a 20pt move on both sides of our VWAP starting point. But the real move came around 30 minutes into the US open where we saw a quick decline down to our lower boundary (50pts lower at 6470) and then briefly over-ran to 6450. But we settled and that 6470 became support for most of the session before reverting back to that declining VWAP to finish the day around 6490.
So, what's the lesson here: a bit of time pre-framing the possibilities for moves in either direction using a combination of stats (ATR, standard deviation of range), other technical analysis tools (support/resistance, VWAP, vol profile) along with experience can help frame the day and the important levels. Use this to start to decide what tools to pull out of the toolbox (trading strategies) and where to initiate trades.
If you find this helpful and would like to see more please let me know.
Happy Trading!

S&P 500 (ES1!): Wait For Longs! Buy The Dip!Welcome back to the Weekly Forex Forecast for the week of Sept 15 - 19h.
In this video, we will analyze the following FX market: S&P 500 (ES1!)
The S&P500 is still bullish, and there is no reason to short it. The Bulls are clearly in control.
As price moves from ERL to IRL, the untouched +FVG below is a great place to look for a high probability long setup.
Enjoy!
May profits be upon you.
Leave any questions or comments in the comment section.
I appreciate any feedback from my viewers!
Like and/or subscribe if you want more accurate analysis.
Thank you so much!
Disclaimer:
I do not provide personal investment advice and I am not a qualified licensed investment advisor.
All information found here, including any ideas, opinions, views, predictions, forecasts, commentaries, suggestions, expressed or implied herein, are for informational, entertainment or educational purposes only and should not be construed as personal investment advice. While the information provided is believed to be accurate, it may include errors or inaccuracies.
I will not and cannot be held liable for any actions you take as a result of anything you read here.
Conduct your own due diligence, or consult a licensed financial advisor or broker before making any and all investment decisions. Any investments, trades, speculations, or decisions made on the basis of any information found on this channel, expressed or implied herein, are committed at your own risk, financial or otherwise.

Will Lowered Interest Rates Make Or Break The Stock Index MarketS&P 500 Fundamentals:
All three of the major indexes posted gains for the week, led by a 2% gain in the Nasdaq, with expectations high the Fed will cut interest rates by at least 25 basis points at the meeting.
S&P ascends second straight week, adds 1.6% on revived artificial intelligence optimism, expected interest-rate cuts.
Price Levels To Lookout For:
- Closure Above $6,600
- $6,450 Weekly Order Block
- $6,223.25 - $6,109.00 Weekly Draw On Liquidity
Nasdaq Fundamentals:
Helping the Nasdaq, shares of Tesla gained 7.4% after board chair Robyn Denholm dismissed concerns that CEO Elon Musk's political activity had hurt sales at the electric-vehicle maker and said the billionaire was "front and centre" at the company.
Price Levels To Lookout For:
- $24,068.50 Prev All-Time HIghs
- $24,200 Psychological Level
- $22,222 - $22,582 Weekly Sellside Liquidity Pool
Dow Jones Fundamentals:
In New York, the Dow Jones Index dropped 231 points or 0.50 percent on Friday.
Losses were led by Merck (-2.75%), Sherwin-Williams (-2.14%) and Honeywell International (-1.79%).
Offsetting the fall, top gainers were Apple (1.82%), Microsoft (1.76%) and Walmart (0.83%).
Price Levels To Lookout For:
- $46,176 (Current Highs)
- $45,245 Weekly Order Block
- $44,642 - $44,615 Weekly BISI

ID: 2025 - 0199.9.2025
Trade #19 of 2025
Entry at 164 DTE
Adding to the overall portfolio to help balance delta in anticipation of a market pullback.
Working GTC orders for take profit in 30-60 DIT.
Happy Trading!
-kevin

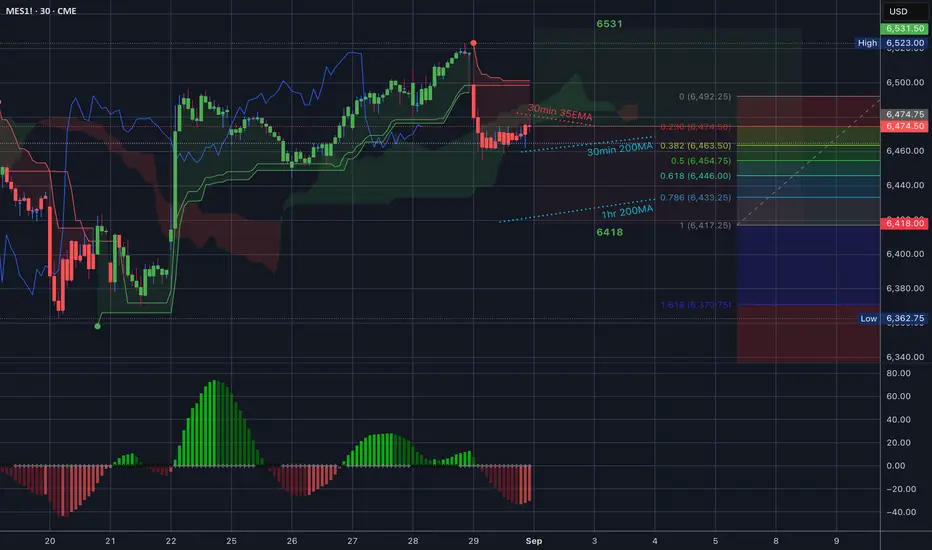
Continued movement to the upsideThe daily structure of the S&P 500 implies continued movement to the upside. The next objective would be 6540.

ES - September 5th - Daily Trade Plan - Evening SessionSeptember 4th - 7:15pm
In today's daily trade plan, I said - "Ideally, we lose 6454, flush and reclaim for a move higher. I expect another choppy day, and we need to clear 6491 to keep this rally moving higher."
At 10:16am price dropped down to 6456.25 and took off higher. You can look at a 4hr chart and see the institutional accumulation that has been happening. You can look at my weekly trading plan in which I stated -
"I do believe we can still rally up to 6547, 6563+ this week, but IF, we lose the 6369 level, that would be a big blow to bulls, and it would need to be sharp reclaim back inside the white trendline to keep momentum."
What did institutions do so far this week? Flush the white trendline, run stops, accumulate and we are heading higher. 6523 is the next big resistance with 6547, 6563 still in play. Price needs to hold 6473 with 6455 being the lowest for us to keep moving higher. Employment report out tomorrow am and usually the initial move will be a fake out. I don't trade prior to the employment report and usually wait until after the NYSE open to evaluate and find a spot to get some points. Since we have closed at highs on the day and we are just going sideways, the best levels that I will be looking for a flush and reclaim would be the 6491 level as it was the high of this week during the Sunday evening session. We could dip down to 6473/79 levels and then rally.
My lean is we grind sideways and up into the 6523 level overnight and then we will need to wait for the employment report and NYSE to try and get some level losses and reclaims to finish the week at our targets of 6547, 6563+.
I will post an updated chart tomorrow before 7am EST.
---------------------------------------------------------------------------------------------------------
Couple of things about how I color code my levels.
1. Purple shows the weekly High/Low
2. Red shows the current overnight session High/Low (New chart out in am)
3. Blue shows the previous day's session High/Low
4. Yellow Levels are levels that show support and resistance levels of interest.
5. White shows the trendline from the August lows.
ES - September 5th - Daily Trade PlanSeptember 5th - 7:55am
Last night session I stated - "My lean is we grind sideways and up into the 6523 level overnight and then we will need to wait for the employment report and NYSE to try and get some level losses and reclaims to finish the week at our targets of 6547, 6563+."
Our overnight session has been rangebound between 6512 - 6531. Employment report and NYSE open will determine which direction we move. I will be waiting for price to settle down after initial reactions and look for the best levels that I will be looking for a flush and reclaim would be the 6491 level as it was the high of this week during the Sunday evening session. We could dip down to 6473/79 levels and then rally.
I will update around after employment report and around 10am.
-------------------------------------------------------------------------------------------------------------------
Couple of things about how I color code my levels.
1. Purple shows the weekly High/Low
2. Red shows the current overnight session High/Low (New chart out in am)
3. Blue shows the previous day's session High/Low
4. Yellow Levels are levels that show support and resistance levels of interest.
5. White shows the trendline from the August lows.
ES - September 4th - Daily Trade PlanSeptember 4th - 6:45am EST
In yesterday's post I said "Ideally, we need to hold the 6426 level or flush and reclaim quickly. IF, price can't rally above 6476, my lean is we are in the midst of a change in character of price, and I will be looking lower for levels to flush and reclaim."
We chopped around all day and ended up breaking below the white trend line to 6426, got bought up and then rallied at end of day. Institutions bought it up and we ended up close to the highs of the day.
Couple of things about how I color code my levels.
1. Purple shows the weekly High/Low
2. Red shows the current overnight session High/Low
3. Blue shows the previous day's session High/Low
4. Yellow Levels are levels that show support and resistance levels of interest.
5. White shows the trendline from the August lows.
What is the game plan for today?
Overnight the low was 6454 with us coming into session highs at 6473.75. Ideally, we can flush 6454 and reclaim for a level to level move higher. IF, price sells off below 6454, we will probably need to head back down to the white trendline which is the 6438 level. 6438-6454 will be a chop fest.
Immediate Resistances - 6473, 6476, 6485, 6491 (Weekly High)
Immediate Supports - 6458, 6454, 6438, 6426, 6412
Ideally, we lose 6454, flush and reclaim for a move higher. I expect another choppy day, and we need to clear 6491 to keep this rally moving higher. We also have employment report out tomorrow am. My lean is we keep chopping up today as we head into the report at 8:30am tomorrow.

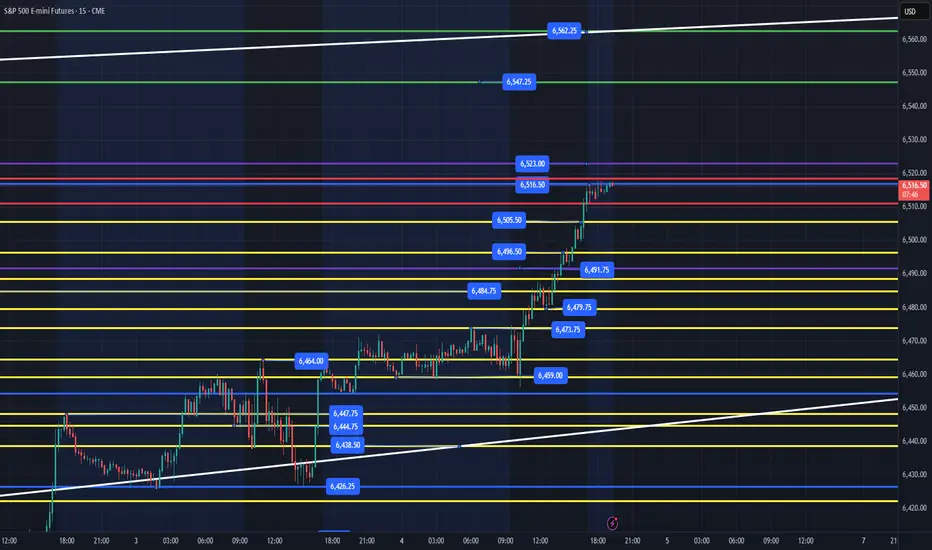
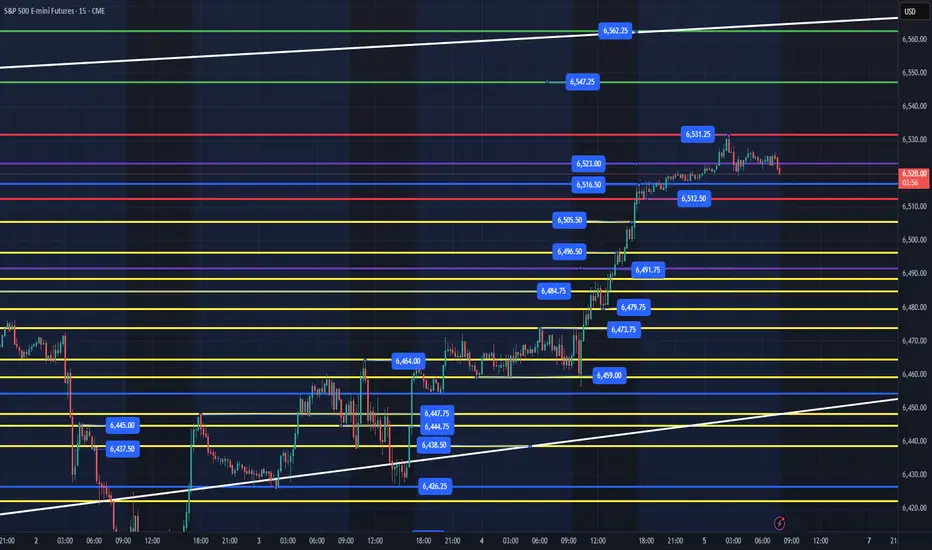
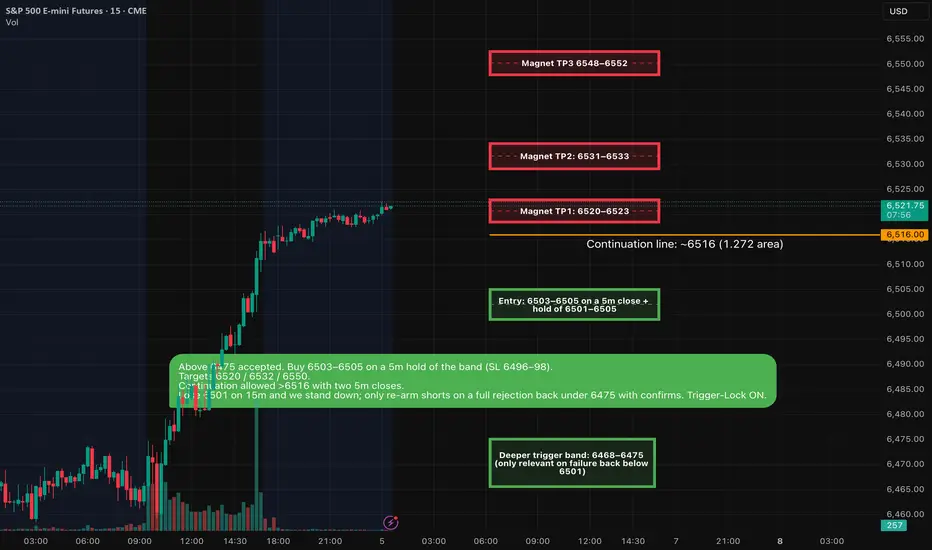
ES — Intraday Analyses & A++ Setups (Fri Sep 5, 2025) • Demand (reclaim): 6501–6505 — now support; Trigger-Lock ON
• Continuation line: ~6516 (1.272 area)
• Upside magnets: 6520–6523, 6531–6533, 6548–6552
• Deeper trigger band: 6468–6475 (only relevant on failure back below 6501)
A++ Long Setup
Retest-Hold LONG
• Entry: 6503–6505 on a 5m close + hold of 6501–6505
• SL: 6496–6498 (≤ 6–8 pts)
• TP1: 6520–6523
• TP2: 6531–6533
• TP3: 6548–6552
Invalidation: Any 15m close < 6501 after acceptance.
Failure / Flip path
• If 6501–6505 fails on a 15m close, expect a deeper probe toward 6475.
• Shorts are not active unless we get the full sequence: rejection of 6468–6475 → 15m bearish < 6466 → 5m failed retest 6447–6451 (then use 6432/6422/6413 TP ladder).
ES - September 3rd - Daily Trade Plan - UpdateSeptember 3rd - 7:25am EST
I wanted to provide an update on today's levels and what has transpired overnight. Price opened around 6448 and grinded down into the white trendline support. This trendline you can also see on the weekly chart (See Related Publications) and yesterday when we dropped below it, we then retested it at 6423 level, tested again in the afternoon to 6426, and we have then back tested it this evening down to 6426 and rallied from there, broke above the overnight high of 6448 and have come into resistance at 6460.
Couple of things about how I color code my levels.
1. Purple shows the weekly High/Low
2. Red shows the current overnight session High/Low
3. Zoom out on a 4hr, 6hr, chart and you will see a trendline from August 22 Low at 6364 which started the massive move to 6496. It is also the same trendline connecting the August 1st low that rallied to 6508. Both levels created rallies that lasted for 200+ pts. That does not mean we will see another rally like that, unless we can reclaim the weekly high of 6491 and then take it level to level from there.
Our first support down is the 6448 level. A flush and reclaim of this level, should take us higher. Each level in yellow are areas that price could flush, recover and climb level to level. My edge as a trader is to try and take 10pts+ out of the market and generally I am looking to do that by flushing a high-quality level, recover and ride it to the next level.
Immediate Resistances - 6460, 6472, 6476, 6485
Immediate Supports - 6448, 6437, 6426, 6412
Ideally, we need to hold the 6426 level or flush and reclaim quickly. IF, price can't rally above 6476, my lean is we are in the midst of a change in character of price, and I will be looking lower for levels to flush and reclaim.
I will send out an update around 10am.
Its Non-Farm: How much will ES Move?Hi all - Happy Non-Farm Friday!
I haven't done this in a while and thought it might be helpful to share my process for estimating the size of the move that we may get on ES after the Non-Farm Payrolls data is released.
I'm not trying to make a prediction on direction here - but more understand where the boundaries could be so I can determine how to trade this (what trading tool I can pull out of my box) once the announcement comes out.
Hope it helps and please let me know if you find it useful and I'll create more posts .
Cheers,
Jeff

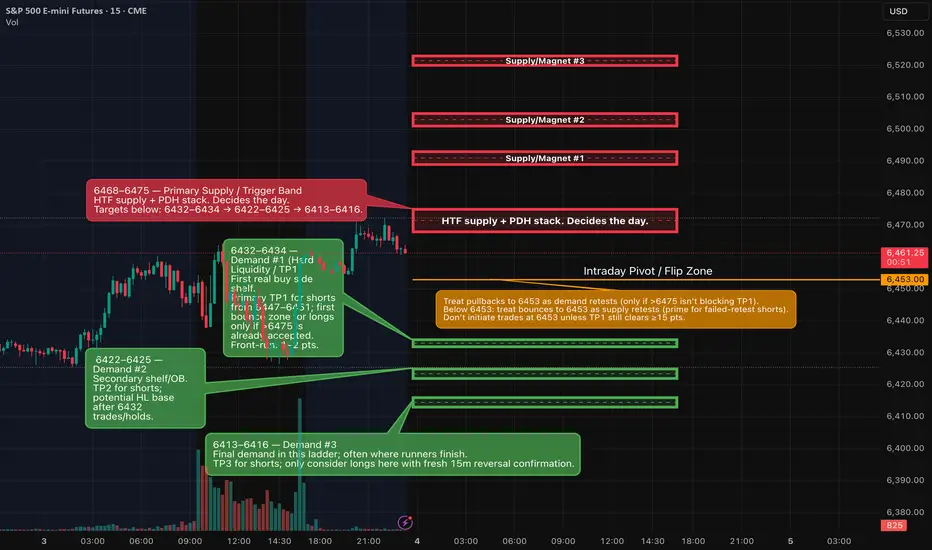
ES (A++) — Intraday Analyses & Setups for Thu, Sep 4, 2025 (ET)We’re parked beneath a well-defined 6468–6475 ceiling. Tomorrow the clean A++ is either: (A) Breakout-acceptance long > 6475 (retest holds), or (B) Rejection short after a test of 6468–6475 that sends price back through 6453 with 15-minute bearish confirmation. TP ladders are mapped to ~6490 / 6501 / 6520 above and ~6432 / 6422 / 6413 below. Trigger-Lock is ON: numbers are frozen once posted.
Weekly/Daily: Pressing prior distribution highs; repeated supply above ~6470–6485; upside extensions show 1.618 ≈ 6489 and 2.000 ≈ 6504 as next magnets.
4H/1H: Recovery from the 6.43k shelf, printing HLs into the ceiling; momentum constructive but unresolved under 6475.
30m/15m: Rangebound day resolved late; resistance band 6468–6475 capped advances; 6453 (Monday Low pivot) is your intraday toggle.
Hard levels to respect
• Ceiling / Trigger band: 6468–6475
• Pivot: 6453 (lose/reclaim toggles bias)
• First downside shelves: 6432–6434, 6422–6425, 6413–6416
• Upside magnets if accepted: 6489–6493, 6501–6505, 6520–6523
A++ Setups
1) Breakout-Acceptance LONG
• Trigger: First 5-minute close > 6475, then a quick retest that holds 6472–6475 (no reclaim < 6470).
• Entry: 6472–6479 on the hold.
• Initial SL: 6466–6468 (≤ 6–8 pts).
• TP1: 6490–6493 (≥ +15 from 6475 → 2.5R with 6-pt risk).
• TP2: 6501–6505
• TP3: 6520–6523
Invalidation: Any 15m close back inside 6468–6475 after acceptance.
2) Rejection-Failure SHORT
• Precondition: Price tests 6468–6475 and rejects.
• Confirm: 15m bearish close < 6466, then a 5m failed retest 6447–6451 (lower high).
• Entry: 6447–6451 on the failed retest.
• Initial SL: 6454–6456 (≤ 6–8 pts).
• TP1: 6432–6434 (≥ +15 from 6449).
• TP2: 6422–6425
• TP3: 6413–6416
Flip: Any 30m acceptance > 6475 cancels shorts and re-arms the long.
Tomorrow’s U.S. calendar (key times, ET)
• ADP National Employment Report: 8:15 am. 
• Initial Jobless Claims: 8:30 am (weekly, DOL). 
• S&P Global U.S. Services PMI (final): 9:45 am (standard PMI schedule). 
• ISM Services PMI: 10:00 am (third business day rule → Sep 4). 
• EIA Weekly Petroleum Status (holiday schedule): 12:00 pm ET (Labor Day shift). 
Long Setup on ES Futures Near Key Support (6360–6365)Looking to initiate a medium- to long-term long position on ES futures around the 6360–6365 zone. After a multi-day pullback, ES is approaching a well-defined support area.
How the price is approaching this level is a great indication of a potential bounce. This type of setup often leads to a strong reaction off key levels.
Entry Zone: 6360–6365
Stop Loss: 6240
Take Profit 1: 6431
Take Profit 2: 6475

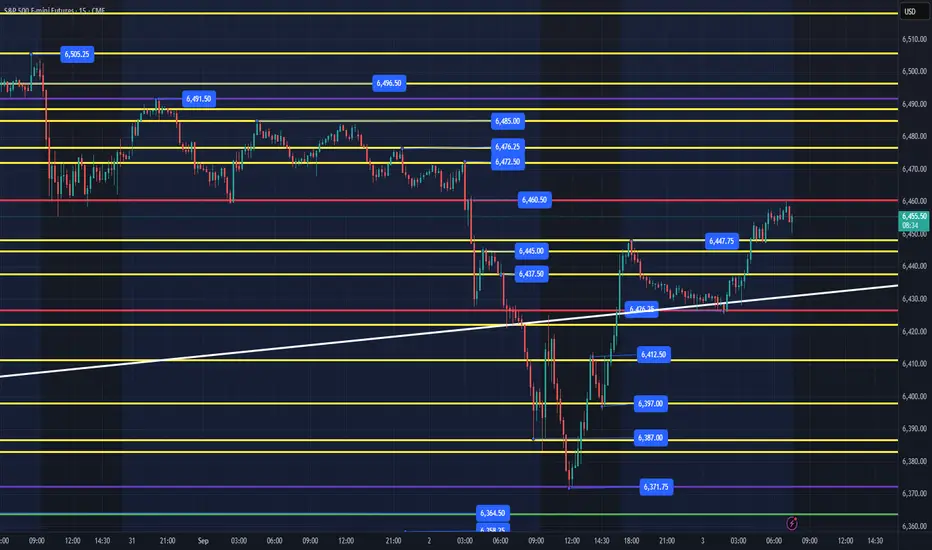
Monday is expected to be an inside dayThe daily structure in the S&P 500 chart implies an inside day for Monday which means Monday would trade within the range of Friday.

$MES_F $ES_F Trading Range for 9.2.25
Ok, so we are heading into tomorrow after the three day weekend a little bearish. Friday every candle printed red and the 35EMA is above us facing down so definitely look to that as resistance.
30min 200MA underneath us still facing up so we could see a technical bounce there, you can see that extended hours are sitting right on top of that level.
And way at the bottom of the trading range we have the 1hr 200MA - good to know that’s there.
Let’s go, y’all. I have officially been converted into a futures trader so new regular ticker right here.
Positive attitudeThe daily price action on Thursday in the S&P 500 indicates a positive attitude of the market going into Friday's labor numbers. It will be interesting to see if buyers follow through with a positive close going into the weekend.

Day 23 — Trading Only S&P Futures | +$200 & New Daily RuleWelcome to Day 23 of Trading Only S&P Futures!
I locked in +200.45 on my competition account by shorting the MOB overnight and walking away once my target was hit. Later in the day, I came back to watch and ended up losing on other accounts — which sparked an important realization.
From now on, I’m considering a rule: cap daily gains at 10% of account balance.
For example, with a $2,000 account, my daily target should be $200 max. Anything more means overtrading, staying in the market too long, and risking unnecessary drawdowns.
This might be the structure I need to keep consistent results.
📰 News Highlights
U.S. JOB CUTS TOTAL 85,979 IN AUGUST, HIGHEST FOR THAT MONTH SINCE 2020 — CHALLENGER
🔑 Key Levels for Tomorrow
Above 6470 = Remain Bullish
Below 6450 = Flip Bearish

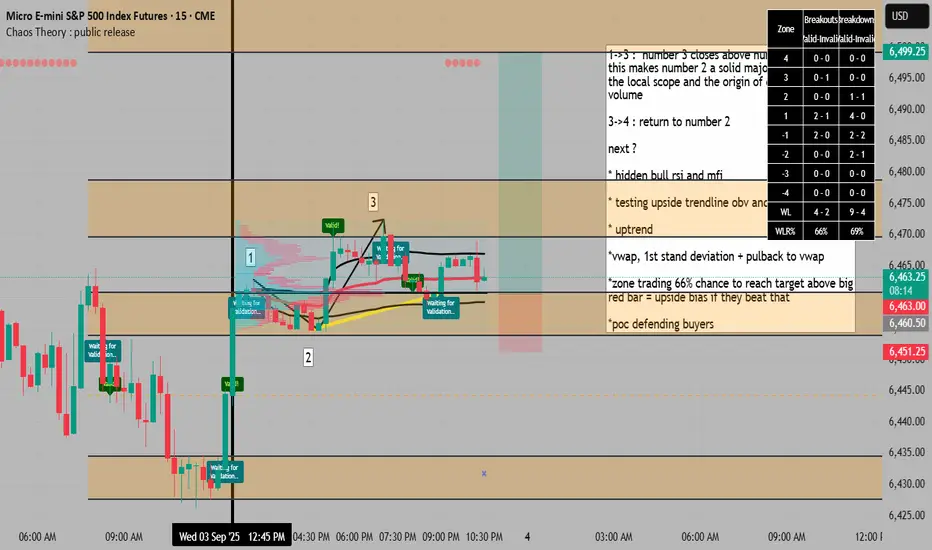
return to proven buyers might be the continuation of trend1->3 : number 3 closes above number 1 ,
this makes number 2 a solid major low in
the local scope and the origin of dominant
volume
3->4 : return to number 2
next ?
* hidden bull rsi and mfi
* testing upside trendline obv and small breaks
* uptrend
*vwap, 1st stand deviation + pulback to vwap
*zone trading 66% chance to reach target above big
red bar = upside bias if they beat that
*poc defending buyers