THTUSD trade ideas

Theta Network (THETA) - June 7Hello?
Welcome, traders.
By "following", you can always get new information quickly.
Please also click "Like".
Have a good day.
-------------------------------------
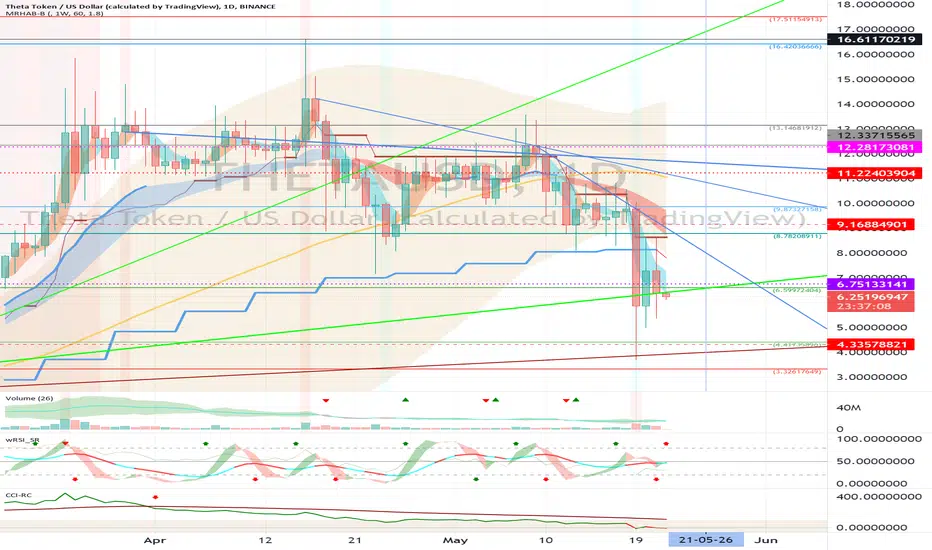
(THETAUSD 1W Chart)
If support is found above the 7.12330856 point, we expect the uptrend to continue.
(1D chart)
We should see support at the 8.78208911 point and see if we can move above the 9.87327158 point.
If it falls from the 6.59972404 point, Stop Loss is required to preserve profit and loss.
-------------------------------------
(THETABTC 1W chart)
It remains to be seen if the price can be maintained above the 18665 Satoshi-20984 Satoshi section.
Since it touched near the 12434 Satoshi point and rose, I think the possibility of a second wave of an upward wave falling below the 12434 Satoshi point is open.
If the 12434 Satoshi point is falling to find support, it is important to see if it can move up along the uptrend line (1).
(1D chart)
We will have to wait and see if we can move above the 25631 Satoshi point along the uptrend line.
If it falls from the 17437 Satoshi point, Stop Loss is required to preserve profit and loss.
------------------------------------------
We recommend that you trade with your average unit price.
This is because, if the price is below your average unit price, whether it is in an uptrend or in a downtrend, there is a high possibility that you will not be able to get a big profit due to the psychological burden.
The center of all trading starts with the average unit price at which you start trading.
If you ignore this, you may be trading in the wrong direction.
Therefore, it is important to find a way to lower the average unit price and adjust the proportion of the investment, ultimately allowing the funds corresponding to the profits to regenerate themselves.
------------------------------------------------------------ -----------------------------------------------------
** All indicators are lagging indicators.
Therefore, it is important to be aware that the indicator moves accordingly with the movement of price and volume.
However, for the sake of convenience, we are talking in reverse for the interpretation of the indicator.
** The wRSI_SR indicator is an indicator created by adding settings and options to the existing Stochastic RSI indicator.
Therefore, the interpretation is the same as the traditional Stochastic RSI indicator. (K, D line -> R, S line)
** The OBV indicator was re-created by applying a formula to the DepthHouse Trading indicator, an indicator disclosed by oh92. (Thanks for this.)
** See support, resistance, and abbreviation points.
** Support or resistance is based on the closing price of the 1D chart.
** All descriptions are for reference only and do not guarantee a profit or loss in investment.
Explanation of abbreviations displayed in the chart
R: A point or section of resistance that requires a response to preserve profits.
S-L: Stop Loss point or section
S: A point or section where you can buy to make a profit as a support point or section.
(Short-term Stop Loss can be said to be a point where profit and loss can be preserved or additional entry can be made through split trading. It is a short-term investment perspective.)
GAP refers to the difference in prices that occurred when the stock market, CME, and BAKKT exchanges were closed because they are not traded 24 hours a day.
G1 : Closing price when closed
G2: Opening price
(Example) Gap (G1-G2)

THETA - Weekly MACD Confirms Fall Into AbyssTitle says it all. MACD has crossed for the first time this year. There's no coming back from this, it is a reversal and I will be looking to buy for pennies down the road.
I first called THETA top at $12 before the crash and can you imagine received a lot of unhappy comments.

ichimoku trade : short positionichimoku signal:
short position:
enter at 7.12$
stop loss kijunsen with buffer

THETA above its Preliminary support (PS), SOS towards $11.30Previous retracements and Fundamentals and pushing THETA above its Preliminary support (PS), We can see how it at the Sign of Strenght (SOS), and ready to climb towards $11.30, then range and climb.
Theta will be releasing a NFT platform by June and this will definatelly help this token to raise.
Happy trading,
Raf

THETAUSD 4h. Ascending Triangle. Target 12.2Hi everyone,
Thank you for considering reading my idea.
Theta formed this ascending triangle pattern, broke to the upside and now we are finding support on top of the triangle. Target to this pattern is at 12.2
Like this idea and follow me for more analysis like this.
Cheers,
Juvs

Theta Network (THETA) - May 22Hello?
Dear traders, nice to meet you.
By "following" you can always get new information quickly.
Please also click "Like".
Have a good day.
-------------------------------------
(THETAUSD 1W chart)
(1D chart)
It remains to be seen if it can rise above the 6.75133141 point along the uptrend line.
If it falls this way, you can touch the 4.33578821 point, so you need to trade carefully.
In order to turn to an uptrend, it must rise above the 8.78208911 point and be supported.
The next volatility period is around May 25th.
--------------------------------------
(THETABTC 1W Chart)
(1D chart)
We must see if we can quickly ascend above the 17437 Satoshi point.
If it falls this way, you can touch the 13341 Satoshi point, so you need to trade carefully.
In order to turn to an uptrend, it must rise above the 18665 Satoshi point and gain support.
--------------------------------------
It is advisable to trade at your average unit price.
This is because if the price flows below your average unit price, which was on an uptrend or downtrend, there is a high possibility that you will not be able to earn a large profit due to the psychological burden.
The center of every trade starts with the average unit price you start trading.
If you ignore this, you may be trading in the wrong direction.
Therefore, it is important to find a way to lower the average unit price and adjust the proportion of the investment, so that the money that ultimately corresponds to the profit can regenerate the profit.
-------------------------------------------------- -------------------------------------------
** All indicators are lagging indicators.
So, it's important to be aware that the indicator moves accordingly with the movement of price and volume.
Just for the sake of convenience, we are talking upside down for interpretation of the indicators.
** The wRSI_SR indicator is an indicator created by adding settings and options from the existing Stochastic RSI indicator.
Therefore, the interpretation is the same as the conventional stochastic RSI indicator. (K, D line -> R, S line)
** The OBV indicator was re-created by applying a formula to the DepthHouse Trading indicator, an indicator that oh92 disclosed. (Thank you for this.)
** Check support, resistance, and abbreviation points.
** Support or resistance is based on the closing price of the 1D chart.
** All explanations are for reference only and do not guarantee profit or loss on investment.
Explanation of abbreviations displayed on the chart
R: A point or section of resistance that requires a response to preserve profits
S-L: Stop Loss point or section
S: A point or segment that can be bought for profit generation as a support point or segment
(Short-term Stop Loss can be said to be a point where profits and losses can be preserved or additionally entered through installment transactions. It is a short-term investment perspective.
GAP refers to the difference in prices that occurred when the stock market or CME and BAKKT exchanges were closed because they are not trading 24 hours a day.
G1: Closing price when closed
G2: Cigar at the time of opening
(Example) Gap (G1-G2)

THETAUSD longI longed THETA, the risk reward profile on this one seems decent, will close 50% at tp1 and 50% of remaining at tp2. Rest for a free ride to the $100 mark 🚀
🚀. Stop set around $9. Volatility looks to be increasing in alts so we could see some large moves soon if we see btc appreciate to the 62K mark and beyond

theta looks overextendedTheta looks overextended, went over the last Fibonacci circle and over the pitchforks, usually that means its overpriced. Better to put your money on Ethereum or Cardano.


BUCKLE UP GUYS! THETA IS ABOUT TO FLY!I have been following this trend for some time now, and it has been pretty accurate every time, so believe me or not, but I think #Theta is going to get a new bull run within only a few weeks, maybe even days. So buckle up and prepare for mass gains on Theta!!!

THETA/USD - Very constructive patternThis bullish smaller timeframe trend is starting to build up. I'll try to catch the smaller waves within the bigger move.

THETA/USD - Another one pointing northVery nice bull flag for this daily timeframe setup. I'll be ready to move this one to breakeven after initial impulse.

THETA looking less lethargicWaiting for the spring and backtest at 11.23
Multiple confirmed bottoms
PCZ a few weeks ago after the initial run up.
DYOR


Theta Network (THETA) - May 3Hello?
Dear traders, nice to meet you.
By "following" you can always get new information quickly.
Please also click "Like".
Have a good day.
-------------------------------------
(THETAUSD 1D chart)
We must see if we can move above the 11.22403904 point and break off the downtrend line.
If there is a movement above the downtrend line, it is expected to continue the uptrend.
If you fall from the 8.78208911 point, you can touch the 6.75133141 point or less, so you need a Stop Loss to preserve your profit and loss.
However, it may rise along the uptrend line, so careful trading is necessary.
On the CCI-RC indicator, the CCI line fell below 100 points.
It remains to be seen if the CCI line can rise above 100 points.
If the CCI line does not rise above 100 points, there is a possibility that it will turn into a downtrend, so careful trading is necessary.
--------------------------------------
(THETABTC 1D Chart)
We need to see if we can get support at the 19486 Satoshi spot and get off the downtrend line.
In particular, it remains to be seen if it can rise along the uptrend line.
If it falls, we need to make sure we get support in the 17437 Satoshi-19486 Satoshi section.
If it falls at the 13341 Satoshi branch, Stop Loss is needed to preserve profit and loss.
--------------------------------------
It is advisable to trade at your average unit price.
This is because if the price flows below your average unit price, which was on an uptrend or downtrend, there is a high possibility that you will not be able to earn a large profit due to the psychological burden.
The center of every trade starts with the average unit price you start trading.
If you ignore this, you may be trading in the wrong direction.
Therefore, it is important to find a way to lower the average unit price and adjust the proportion of the investment, so that the money that ultimately corresponds to the profit can regenerate the profit.
-------------------------------------------------- -------------------------------------------
** All indicators are lagging indicators.
So, it's important to be aware that the indicator moves accordingly with the movement of price and volume.
Just for the sake of convenience, we are talking upside down for interpretation of the indicators.
** The wRSI_SR indicator is an indicator created by adding settings and options from the existing Stochastic RSI indicator.
Therefore, the interpretation is the same as the conventional stochastic RSI indicator. (K, D line -> R, S line)
** The OBV indicator was re-created by applying a formula to the DepthHouse Trading indicator, an indicator that oh92 disclosed. (Thank you for this.)
** Check support, resistance, and abbreviation points.
** Support or resistance is based on the closing price of the 1D chart.
** All explanations are for reference only and do not guarantee profit or loss on investment.
Explanation of abbreviations displayed on the chart
R: A point or section of resistance that requires a response to preserve profits
S-L: Stop Loss point or section
S: A point or segment that can be bought for profit generation as a support point or segment
(Short-term Stop Loss can be said to be a point where profits and losses can be preserved or additionally entered through installment transactions. It is a short-term investment perspective.
GAP refers to the difference in prices that occurred when the stock market, CME, and BAKKT exchanges were closed because they do not trade 24 hours a day.
G1: Closing price when closed
G2: Cigar at the time of opening
(Example) Gap (G1-G2)

THETAUSD Strong long-term buy signalPattern: Channel Up on 1D.
Signal: Buy as the price rebounded within the 1D MA50 (blue trend-line) MA100 (green trend-line) zone, which has been the strongest buy signal since June 2020. Confirmation when the LMACD forms a Bullish Cross.
Target: 115.000 (just below the 3.5 Fib extension and the 1.5 Fib level of the Channel).
** Please support this idea with your likes and comments, it is the best way to keep it relevant and support me. **
--------------------------------------------------------------------------------------------------------
!! Donations via TradingView coins also help me a great deal at posting more free trading content and signals here !!
🎉 👍 Shout-out to TradingShot's 💰 top TradingView Coin donor 💰 this week ==> EBITDAtiger
--------------------------------------------------------------------------------------------------------

THETA Coin Breaks Above 50-EMA, Going To Hit $14.55THETA coin price traded at $10.96 with a loss of 3.60% in the last 24-hour and 8.98% up in the weekly time frame. Furthermore, THETA coin price bounced from the support of $8.15. In contrast, the market capitalization stands at $369 million. Technically, investors can perceive a positive crossover in the EMA, and the price is above the 55-EMA. RSI index showcases an upward slope. Moreover, the price movement can be towards the resistance of $14.55 in future trading sessions.
Resistance: $14.55
Support: $8.15

THETA Wave CountBe aware that the Fibonacci extension levels are different depending on which exchanges you look at.


