THTUSD trade ideas

THETAUSD H8: 75% gains BEST LEVEL TO BUY/HOLD(SL/TP)(UPDATE)Why get subbed to me on Tradingview?
-TOP author on TradingView
-2000+ ideas published
-15+ years experience in markets
-Professional chart break downs
-Supply/Demand Zones
-TD9 counts / combo review
-Key S/R levels
-No junk on my charts
-Frequent updates
-Covering FX/crypto/US stocks
-before/after analysis
-24/7 uptime so constant updates
🎁Please hit the like button and
🎁Leave a comment to support our team!
THETAUSD H8: 75% gains BEST LEVEL TO BUY/HOLD(SL/TP)(UPDATE)
IMPORTANT NOTE: speculative setup. do your own
due dill. use STOP LOSS. don't overleverage.
READ ENTIRE IDEA BEFORE EXECUTING.
🔸 Summary and potential trade setup
::: THETAUSDT 8hours/candle chart review
::: updated outlook still valid today
::: BUY LOW was alerted at 1.11 USD
::: +25% gains already / congrats
::: final TP BULLS +80% gains BUY/HOLD
::: currently BUY DIPS / PULLBACKS
::: noteworthy compression in progress
::: falling wedge in downtrend
::: chart is LOG SCALE
::: get ready to BUY LOW later
::: after pullback
::: best reload zone BULLS is 1.05 USD
::: up to 75% gains possible after
::: ACCUMULATION in progress
::: however use SL below 1.05 (TIGHT SL)
::: do your own due dill
::: and use proper risk management
::: TP bulls is +75% gains
::: details: see chart
::: FINAL TP is 75% gains 1.75 USD
::: recommended strategy: BUY/HOLD after pullback
::: TP BULLS +75% gains 1.75 USD
::: SWING TRADE: BUY/HOLD IT
::: bull run not over yet
::: good luck traders!
::: BUY/HOLD and get paid. period.
🔸 Supply/Demand Zones
::: N/A
::: N/A
🔸 Other noteworthy technicals/fundies
::: TD9 /Combo update: N/A
::: Sentiment mid-term: BULLS/BREAKOUT
::: Sentiment short-term: PULLBACK/CORRECTION
RISK DISCLAIMER:
Trading Crypto, Futures , Forex, CFDs and Stocks involves a risk of loss.
Please consider carefully if such trading is appropriate for you.
Past performance is not indicative of future results.
Always limit your leverage and use tight stop loss.


THETA is about to skyrocket
theta oscillates in the bottom box
Once out of the box
will start to soar
Follow me to take you to achieve financial freedom

THETAUSD H3: 75% gains BEST LEVEL TO BUY/HOLD(SL/TP)(NEW)Why get subbed to me on Tradingview?
-TOP author on TradingView
-2000+ ideas published
-15+ years experience in markets
-Professional chart break downs
-Supply/Demand Zones
-TD9 counts / combo review
-Key S/R levels
-No junk on my charts
-Frequent updates
-Covering FX/crypto/US stocks
-before/after analysis
-24/7 uptime so constant updates
🎁Please hit the like button and
🎁Leave a comment to support our team!
THETAUSD H3: 75% gains BEST LEVEL TO BUY/HOLD(SL/TP)(NEW)
IMPORTANT NOTE: speculative setup. do your own
due dill. use STOP LOSS. don't overleverage.
READ ENTIRE IDEA BEFORE EXECUTING.
🔸 Summary and potential trade setup
::: THETAUSDT 3hours/candle chart review
::: updated outlook still valid today
::: noteworthy compression in progress
::: falling wedge in downtrend
::: chart is LOG SCALE
::: get ready to BUY LOW later
::: after pullback
::: best reload zone BULLS is 1.05 USD
::: up to 75% gains possible after
::: ACCUMULATION in progress
::: however use SL below 1.05 (TIGHT SL)
::: do your own due dill
::: and use proper risk management
::: TP bulls is +75% gains
::: details: see chart
::: FINAL TP is 75% gains 1.75 USD
::: recommended strategy: BUY/HOLD after pullback
::: TP BULLS +75% gains 1.75 USD
::: SWING TRADE: BUY/HOLD IT
::: bull run not over yet
::: good luck traders!
::: BUY/HOLD and get paid. period.
🔸 Supply/Demand Zones
::: N/A
::: N/A
🔸 Other noteworthy technicals/fundies
::: TD9 /Combo update: N/A
::: Sentiment mid-term: BULLS/BREAKOUT
::: Sentiment short-term: PULLBACK/CORRECTION
RISK DISCLAIMER:
Trading Crypto, Futures , Forex, CFDs and Stocks involves a risk of loss.
Please consider carefully if such trading is appropriate for you.
Past performance is not indicative of future results.
Always limit your leverage and use tight stop loss.

THETA - $1 Hit, Now Time To Buy 🚀I wasn't going to make a thread on THETA but since my bearish call went so well for it from $12 down to $1 in tandem with BTC to hit 20K, I thought I will make one for the potential reversal here.
The only reason I didnt make a thread is that THETA isn't the cleanest chart here. As yet it has not reversed at any particular Fibonacci juncture, it didn't quite reach support and it didn't quite go oversold on the weekly RSI.
And of course it could go a bit lower and fulfil those things, but unless BTC does also then I dont think it will and i think its a reasonable chance BTC bottom is in. And thats crypto - fast, wild and volatile and you dont always get the cleanest chart.
But what you do get with THETA is multipliers and if it did bounce in this area then a typical 0.7 (could be more) retracement would be a x7 from the low, so this one is well worth having imo.
I have linked the thread from 2021 when THETA was at $12 a year ago. Quite funny and some fairly vulgar comments 😸.
Not advice.

THETA LONG SETUPNFI EDUCATIONAL.
Range deviation target is EQ i think price of now is deviation of the THETA daily range.

THETA - beautiful channelingQuick writeup
We can clearly see how THETA respects channels it's in. Last 5th wave still awaits. Is this the start? Unclear. If you want confirmation, wait for the price to break the upper border of the channel.
EW basics on chart:
- 5 waves
- alternation law: one correction is flat, the other is zigzag
- zigzag is a deeper one

THETA TOKEN weekly chart future outlook over the next 483 days?THETA weekly chart: as we continue to finalize
the bottom of the market, which we are there
or very very close in my opinion, we have this
projection of price action in the next 483 days.
This senario is very similar with other digital
assets from years ago and played out...lets just
keep our eyes on the chart and what the RSI,
trendlines and Fibonocci extentions give us...

Theta network - broken market structure - bear marketOn the above 2-day chart price action has appreciated a massive 27500% in just a little over 300 days since the life cross.
I’m afraid a death cross has just printed on this 2-day chart, which means price action is now in a bear market.
A bear market is defined as:
1) The 50-day SMA (blue line) crossing down the 200-day (red line).
2) Price action trading under the 200-day.
As this is a 2-day chart the 50 and 200-day SMAs are actually 100 and 400 days of data. This is particularly powerful as the day chart can prints false signals. This isn’t one of them.
Additionally price action has printed a lower low from the last higher low. This is broken market structure.
On the 10-day chart below price action is printing a candle body below the annual EMA. This is not a EMA you want to be on the wrong side of. If confirmed, i.e. a full candle body, closes under the EMA by January 1st it will be a year+ before it gets back above.
Lastly 93 of 100 ideas recently published on tradingview are ‘long’. If there’s one statistic that never fails the test of time, 95% of all traders lose money. Will you be one of them?! No emotion = profit.
Good luck!
WW
10-day chart with annual ema (green line)

in the beginning of the 2nd wavecrab harmonic pattern:
X=$14.85
A=$0.028
AB=0.38 XA
BC=0.88 AB
0.23 XA=$0.125
0.78 BC=$0.198
0.88 BC=$0.245
1.13 BC=$0.41
0.5 XA=$0.65
1.41 BC=$0.74
1.6 BC=$1.16
0.61 XA=$1.36
2 BC=$2.61
0.78 XA=$3.9
2.24 BC=$4.35
0.88 XA=$7.28
2.6 BC=$9.71
1.13 XA=$33.47
3.6 BC=$81.17
1.27 XA=$81.3
1.41 XA=$192
4.23 BC=$301
1.6 XA=$706

THETA - Target Hit!!! 🥳 🎈🎈One year ago in May 2021 when THETA was way up at $12, while BTC was topping and almost everyone thought crypto was in a bullish "supercycle" I projected that THETA would instead crash 90%+ down to $1.
And I'm sure you can imagine how well appreciated that was from the bulls that were in great numbers back then and [passionately looking to the stars for much more gains. Comments sections were much more vibrant back then albeit with some strong language here and there. One bull even said he will pay me $10K if my projection come true. You can probably also imagine that no such payment has arrived as yet 😄.
Anyhow THETA has now hit my $1 target and lost 93% from ATH. It also now finds itself in capitulation under the 200 week MA.
If this is to be a buy I have highlighted an area that there is a lot of supportive activity and also is just passed the log 0.618 which seems a likely overshoot for reversal.
It can of course have a bounce on the way.
These are just my charts, I'm not here to tell you which coin is or isn't the best thing since sliced bread.
Hopefully some of you probably not all of you enjoyed this call.😄
Not advice.
@crypto-investor1999, THETA has hit $1 and you said you will pay me $10K 🤗.

THETA $25 in 2023 I believe that THETA can reach the $25 price point in the coming year. This would put the token at a 25Bn market cap.

TRYX ANALYSIS | THETAUSD|THETAUSD is also in a support zone, waiting for the fundamentals to take advantage. Let's hope it doesn't break the support area and go down.

THETA Logarithmic Regression IdeaTHETA experienced 450x gains over the course of a year from March 2020 to March 2021 and has been consolidating since. It is one of the few blue chip projects that has seen no major bounces or relief since it peaked and since the May 2021 market crash. Should the bull market continue from here, or we are to experience only a short bear season, THETA is primed to explode more than most, but here we can theorize what to expect if we are in fact in a multi-year bear market. By throwing together a rough logarithmic regression analysis using THETA's own fractal and stretching it to account for lengthening cycles, we can see that a price target of $500 within a few years is not out of the question. This would produce 250x gains from a $2 bottom. Worst case I would expect THETA to find a bottom around $1.50, which would only further gains if you can catch the flush.
Fundamentally, THETA is strong. It has an active team, unique use case that is being leveraged by partners such as WPT and GFUEL, and the network is supported by major companies like Samsung, Sony and Google. If we can't turn the market around in the short term, I think it will survive a prolonged bear market, so I'd like to be prepared for either scenario. I've been accumulating THETA heavily as I believe we are ultimately in a good buy range and I'm willing to wait if I have to. As always, DYOR and trade based on your own objectives, timelines and risk tolerance levels.

THETA Downtrend BrokenSimilar situations are portrayed on this THETA chart
A breaking of a downtrend (dashed line), leads to a rise in price
The indicator 'Gaussian Channel' acts very similar in both situations, a curved rise


Theta Will Bounce SoonTheta Network is a solid one, with good fundamentals.
Metaverse, NFT's, Streaming, DeFI incoming, etc.
For now it's down 80% from ATH of last year. It's possible to have a rebound till 6$ minimum if btc settles in this area for a while.
Starting to accumulate at 3$ and below, till 2$.

THETAUSD targeting $5.2250 on a fractal repeat.Theta Token is trading within a Channel Down and has just recently broken above its 1D MA50 (blue trend-line again). Even though the price remains just inside the Channel Down, that break-out on the previous similar Channel Down of April- July 2021 was a buy signal towards the 0.618 Fibonacci retracement level. That is currently at 5.2250. Notice how we are at the exact same RSI spot of that Channel Down break-out.
--------------------------------------------------------------------------------------------------------
** Please support this idea with your likes and comments, it is the best way to keep it relevant and support me. **
--------------------------------------------------------------------------------------------------------

Theta Network (THETA) - February 12Hello?
Traders, welcome.
If you "follow", you can always get new information quickly.
Please also click "Like".
Have a nice day.
-------------------------------------
(THETAUSD 1W Chart)
(eng)
If the price is maintained above the 1.9172 981-2.9437 615 range, it is expected to create a new wave.
The price needs to rise above the 4.3357 882 point to hold the price in order to turn into an uptrend.
If it declines from the 1.9172 981 point, it is expected to enter the mid- to long-term investment zone, so careful trading is required.
If it moves above the 4.3357 882 point and breaks out of the downtrend line, I expect to find primary resistance near the 6.9164 138 point.
(1D chart)
First resistance section: around 6.4637 041
Second resistance section: 8.6007 292-9.6682 416
Support section: 3.2581 665-4.3266 790
The trend is expected to continue out of the 2.9437615-4.8165031 section.
--------------------------------------
(THETABTC 1W chart)
If the price holds above the 0.0000 753 point, it is expected that it will lead to an uptrend to create a new wave.
However, to convert to an uptrend, it must rise above the MS-Signal indicator.
Therefore, it should rise near the 0.0001243 point.
Movement around the week that includes February 28 should see if we can break above the MS-Signal indicator above.
If it rises above the 0.0001 243 point, I would expect it to rock up and down on the 0.0001 243-0.0001 473 section.
------------------------------------------
We recommend that you trade with your average unit price.
This is because, if the price is below your average unit price, whether the price trend is in an upward trend or a downward trend, there is a high possibility that you will not be able to get a big profit due to the psychological burden.
The center of all trading starts with the average unit price at which you start trading.
If you ignore this, you may be trading in the wrong direction.
Therefore, it is important to find a way to lower the average unit price and adjust the proportion of the investment, ultimately allowing the funds corresponding to the profits to be able to regenerate themselves.
------------------------------------------------------------ -----------------------------------------------------
** All indicators are lagging indicators.
Therefore, it is important to be aware that the indicator will move accordingly as price and volume move.
However, for convenience, we are talking in reverse for the interpretation of the indicator.
** The MRHAB-O and MRHAB-B indicators used in the chart are indicators of our channel that have not been released yet.
(Since it was not disclosed, you can use this chart without any restrictions by sharing this chart and copying and pasting the indicators.)
** The wRSI_SR indicator is an indicator created by adding settings and options to the existing Stochastic RSI indicator.
Therefore, the interpretation is the same as the traditional Stochastic RSI indicator. (K, D line -> R, S line)
** The OBV indicator was re-created by applying a formula to the DepthHouse Trading indicator, an indicator disclosed by oh92. (Thanks for this.)
** Support or resistance is based on the closing price of the 1D chart.
** All descriptions are for reference only and do not guarantee a profit or loss in investment.
(Short-term Stop Loss can be said to be a point where profit and loss can be preserved or additional entry can be made through split trading. It is a short-term investment perspective.)
---------------------------------

$THETA needs to break up out of this channel and do a new ATH If Theta can break out of this downward channel a 10x move is on the cards this year.

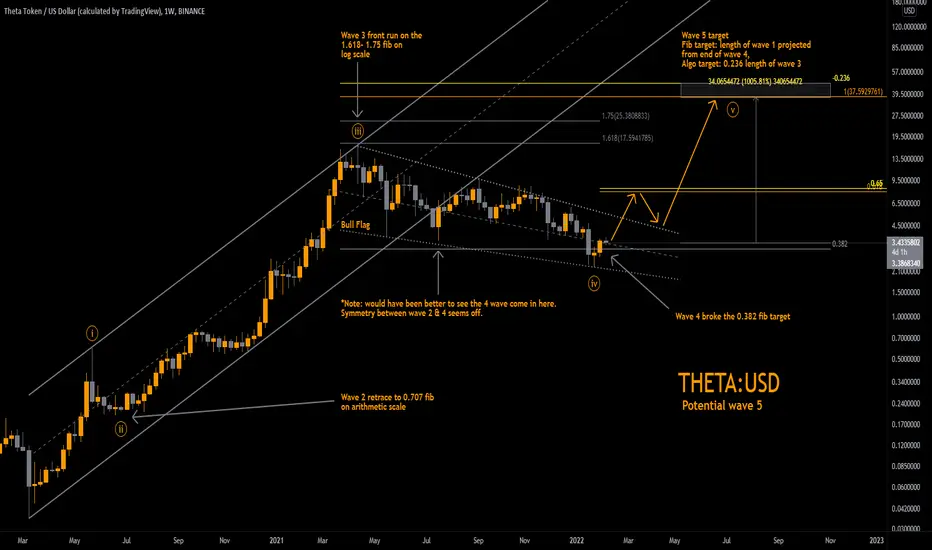
THETA : USD Wave 5 target $37.60 - $47.41THEATA : USD
Potential wave 5. The fib relationships look good but the time its taken for wave 4 to complete when compared to wave 2 isn't great. EMAs are bearish. That leads me to consider two main options, 1 this is a bear market relief rally or 2 its still a bull market and wave 5 has just begun. The bull flag is enticing and the risk reward on this trade is very good. There's a potential for a 10x with very little downside is stops are places responsibly.
Key Points:
Wave 2: Hit high probability fib target of 0.707
Wave 3: Front run high probability fib target of 1.618
wave 4: Overshot high probability target of 0.382
Bull flag: Break and test from above to continue macro trend
Daily EMAs: We are below the 144, 169, 244 EMAs & they have crossed bearish on the daily. This is not bullish. Needs to breakout and test from above.
The trade:
Entry 1: Around here, $3.42 - 1hr chart has broken out and retested 244 EMA. 169 & 244 EMA has crossed bullish.
Entry 2: Break out and retest of the 244 EMA on the 4h chart combined with bullish cross of 169 & 244 EMAs.
Entry 3: Break out and retest of bull flag: ~$4.20 - $5.20
Stop 1: Break of the 244 EMA on 1h, currently at: $3.24 (-5.6%)
Stop 2: Once 4hr EMAs have crossed bullish and price has tested from above, stops at 244 EMA on 4hr chart.
Target 1: 169 EMA on the daily currently at $5.13 but sloping down and decreasing. (+54%)
Target 2: 0.618 relief rally = $7.80 (+132%)
Target 3: Fib: length of wave 1 projected from the end of wave 4 = $37.60 (=1017%)
Target 4: Algo: 0.236 length of wave 3 projected from end of wave 3 = $47.41 (+1300%)
Notes:
Symmetry looks off.
Relationship between wave 2 & 4 doesn't have the 'right look'
Wave 4 has taken much longer that wave 2.
EMAs bearish on higher timeframes
Never Trust. Verify.
Not taking requests so please don't ask.
D.Y.O.R. Not Financial Advice Just an Observation.
Technical Analysis is not about being right, it's about increasing your odds.
Be prepared to be wrong. Risk management is key . Capital preservation above all else.
Theta Network ($THETA) New DTF FIBTheta Network ($THETA) New DTF FIB: $THETA is extremely undervalued (as well as other blue chip altcoins). $THETA was $15 at one point in time and its mind blowing to see it at $2.60
