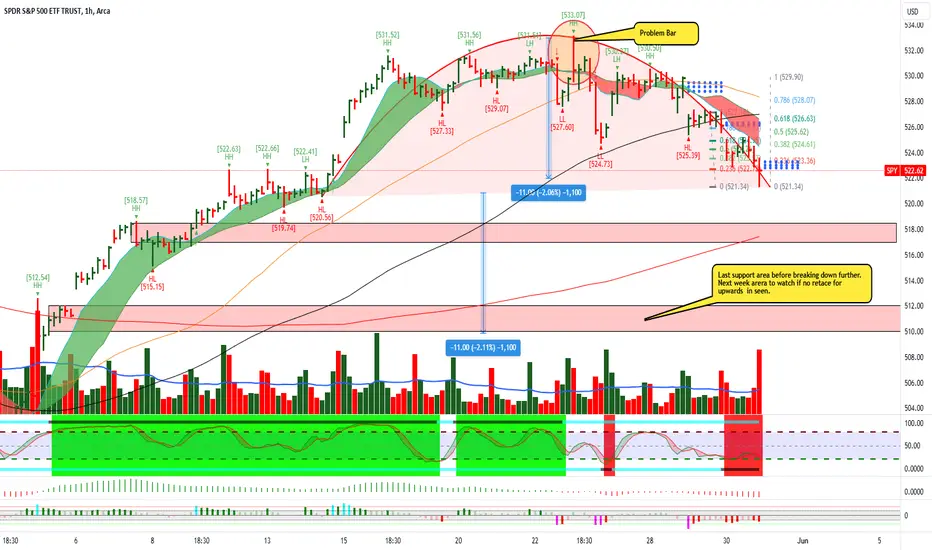
SPY: How much Higher will it go? In this video I attempt to address the question I think everyone is wondering, "how much higher will this go?".
In addition, I briefly talk about next week's levels and probability.
Safe trades everyone!
1557 trade ideas

$SPY May 30,2024AMEX:SPY May 30,2024
15 Minutes.
At the moment long only above 533.07 for any higher targets.
A The rise from 493 to 533
B The rise from 519.74 to 533.07
C the fall from 529.9 to 525.39
AT the moment these are the 3 important numbers.
At the moment I will consider B and C only.
For the rise B important to hold 524 levels being 61.8% retracement for the rise.
For the fall 529.9 to 525.39, a retracement to 528 levels will give an opportunity to short.
At the moment upside is limited to 532 533 levels
Since we have multiple touch points on 531-533 levels, I expect a swift move upside once 533.5 is crossed convincingly.
And on downside 524 is important to hold. If 524 is broken, then we can see at least 521-522 as target which is 21 ema in daily.
So, I will think only on short side today.

spy weekly 27th MAY 2024This is my analysis for SPY for this coming week. I have clearly explained the levels and my intentions. Let me know if you have nay doubts.
NOTE:WE ARE BULLISH

$SPY May 29, 2024AMEX:SPY May 29, 2024
15 Minutes
The steep fall from 533.07 to 524.73 is getting sorted out. Sideways consolidation.
For the risefrom 524.73 to 530.5 AMEX:SPY has retraced nearly 61.8%.
Consider the last rise from 527.11 to 529.8 holding 528 levels i have a target 530 - 532 levels and on downside if 527 is broken possible target is 524-525 levels.
So being 2$ on both sides i prefer to sit out today also.

SPY Fibonacci Price Theory And BreakOut BarsThis instructional video teaches you the basics of Fibonacci Price Theory in conjunction with Breakout Bars and how price is the ultimate indicator.
Throughout this video, I try to provide instruction on key elements related to the Fibonacci Price Theory (Unique & Standout Highs/Lows). Additionally, I've also included Breakout Bars and Fibonacci Price Retracement concepts.
What I really hope you learn from this video is to see price as the true ultimate indicator for your trading decisions. Using technical analysis techniques is fine, but use price as the key element when trying to confirm or reject your trading ideas.
I hope this helps you understand that price, action, and reaction through trends, peaks, and troughs are the most important components of the chart. Everything else is peripheral.

$SPY range $479-$529, the path to the top (and bear market)AMEX:SPY looks to be showing signs of weakness here. Thinking that we could see the first large decline of the year into one of the support levels below $479-$495. Breaking the trend line would be the trigger.
If that happens and we do get a low, then I think we'll have one final rally to the upper resistance levels between $525-$530.
Another possibility, is we just continue upwards to the top resistance levels and then decline after. Idea of a range is you want to buy the lows (supports on chart) and sell the highs (resistances chart).
Regardless of the path we take, we're nearing a top in the market and after we hit those top levels, I expect a large decline lower (one that takes us past the prior 2022 lows).
Ultimately looking for SPY to reach the $280-300 level by the end of 2024. But let's save that analysis after we see what happens in this range.

BIG MOVE! SHORTS TRAPPED! What's next?Based on the chart analysis, the rising wedge pattern signals a likely bearish correction in the short term, with the price potentially testing the 0.618 Fibonacci retracement level around $518.36 as a key support. However, the Elliott Wave projection suggests a bullish reversal toward point (C) if support holds, indicating a medium-term upward move. Traders should watch for confirmation of support at the 0.618 level and look for signs of reversal to enter long positions, targeting the previous high around $532.99 and beyond. We must stay above $524.71 to escape this wedge channel and maintain the potential for an upward breakout. Maintain vigilance for a break below the 0.618 retracement, which could signal further downside risk.
Leave a comment of what you think about where the market is heading!

SPY: First week of June Hey everyone,
Posting an idea. I will be away next week, God willing, on a ship 🚢, in the Bahamas 🌴, so figured I would post now, because I will pretty radio silence for next week and haven't decided whether I will make an effort to track the market while on the sea or not. Probably not from the looks of the probs, so let's get into expectations next week.
Daily probability on Monday is bullish, which works well for the bull flag SPY left off on.
The TPs are in the chart. Biggest concern you have is we fell below overhead trend resistance at approximately 530. So watch this area.
Probability on the week indicates inside. You may get away with buying the dip, shorting the rip next week as a result. Most critical I would argue being that 530 trend resistance.
Reference target is at 528.12. We open above, we will sell down to this point. We open below, we will buy up to this point. 80 ish % of the time.
Inside week makes sense with the following week containing NVDA stock split and FOMC.
Be weary of NVDA stock split, this is a bearish event for most stocks and it was for NVDA's last split as well. I got burned on that the last time😩.
FOMC I have no expectations.
Going into the following month (July) we will have new 3-month levels and new 6-month levels with the high prob target, so curious about that.
In terms of TP expectations for next week, 530 is what I expect.
Safe trades everyone and catch you in 1 week!

$SPY June 3, 2024AMEX:SPY June 3, 2024
60 Minutes.
On Friday as expected both 518 and 526-527 was done.
My buy is still above 533.5 only.
For the fall 533 to 518.3 AMEX:SPY retraced exact to 61.8% being 527.4.
For the rise from 518.36 to 527.5 holding 524 I have a target 530.
But I am biased towards 512-518 until I see a change in trend.

SPY bigger pictureI am going slowly short.
SPY should make another leg down this week.
Level of interest is 475-470
Lets see what Wednesday will bring, until then we should stay flat.
From the lows of 470, we shall do the usual election run.
target 548?
Ill be updating this idea.

SPY WEEKLY 3rd June 2024Welcome to SPY Weekly. I have discussed the levels where to go long. If you have any doubts or questions please feel free to DM here on X.
NOTE: DO NOT BUY CALLS

$SPY & CRE PanicIgnoring mainstream news and whatever and only using my data i'm seeing that CRE is experiencing unknown trouble. While SPY and other indices have been pumping possibly thanks to NVDA, CRE has been experiencing big trouble.
I think CRE trouble may spill over to the rest of the market as some kind of SVB/SIVB-like event sometime soon e.g June/July and will end at the start-mid August.
In my data below there's a big gap between SPY & CRE. When this gap first started forming, SPY did follow CRE data downwards but then got saved by... i dunno NVDA, the rest of the market... no idea. imgur.com
Point is the gap still exists and gaps are always fulfilled by being closed off one way or another.
"In a deep pub Clive British voice": I recon SPY goes down soon.
There's a chance we triple top on SPY before anything actually happens e.g we visit $523, then back up to $535, then after some consolidation finally break downwards to the $465's area. Actually hoping we this current double top resolves starting now and we do a quick visit to $465 before rebounding back upwards.
Thanks for attending this Ted talk.

S&P stalls in indecision; still bullishLast week was marked with indecision. Market was moving in a narrow range while Buyers were waiting for FOMC ad NVDIA’s earnings. After receiving positive confirmation (FOMC neutral, earnings good) market tried to go higher but found no support from large players. Sellers took advantage of the weakness and dropped price, clearing many weak longs established in the previous 5 days. It was a strong move but for some reason sellers lacked conviction to go lower. Price pivoted after filling the gap from Wednesday 15th and went back into the balance zone ( 527.5-531.5 ).
We should expect more pushes and pulls in the short term while market is fishing for new information. To confirm their control buyers must clear last week high ( 533 ) and build value above it. Bears’ objective is to break last week low ( 525 ). Until it happens the most likely scenario is bracketing within last week range.
It is important to note that while short term direction is unclear, we are still in weekly uptrend. So bears must work twice hard to prove their strength
Disclaimer
I don't give trading or investing advice, just sharing my thoughts.

$SPY May 31, 2024AMEX:SPY May 31, 2024
60 Minutes.
As expected, 522 was achieved.
21 ema of daily done.
In Both daily and 60 minutes the bar making ATH is the issue. It had close near low of bar.
Hence long for higher target is only above 533.5 levels with close near top of bar.
Yesterday i had shared A, B And C.
And said B and C was important for the day.
Today i will consider A the rise from 499.55 to 533.
We can see in daily the rise was swift.
Thats being corrected now.
I expect AMEX:SPY to consolidate around 516 - 517 levels before next uptrend as long as 488-492 is held on any retrace.
Now for the day in 15 minutes we have oscillator divergence.
AMEX:SPY making LL but not supported by Oscillator.
Considering the fall 529.9 to 521.34 a retrace to 526.5 is possible being 61.8% retracement and 10 averages too.
So today contra trade could be a buy around 522 - 522.5 levels for 525 - 526 as target or sell 525-526 for 518-519 levels.
back to ATHs very possibleAMEX:SPY had an interesting wick
In my opinion all it did was rebalance, and took some stops i honetsly see it opening limit up on tuesday

This is my personal planDrew a line for where I'm looking SPY to open tomorrow, hoping buyers swoop in and try for ATH, should be easy since all the big names are down but without catalyst for correction. Either way, looking towards second week of June if the medium time frame MA is to be followed.
Just hard to believe that Friday's inflation data will be positive -- but I'm thinking while inflation holds steady, household income will fall, and we'll see how markets react to that.
Otherwise, chop chop

$SPY update 5%+ correction then retest of highsOriginally I was thinking that we'd see a move to the $480 support after testing the highs, however, because we haven't fallen yet, the chart no longer supports that view.
Instead, I think the most likely scenario is that we fall on or after Wednesday 5/29 back to the low $500 area, then we go back to test the highs at $530.
The retest of $530, will setup the lower high which will start the bear market.
So basically there's one more chance to buy the dip in the low $500s, ride that back to the highs, and then you'll want to be a seller from July onwards.
Let's see how it plays out.

SPY short hunt is ontoday is still early and will say next week for real signal but will put on a few puts today

S&P bulls are unstoppable; market reaches new highMarket closed strongly last week after reaching a new historical high. There was some sluggish consolidation on Thursday-Friday but near end of Friday trading hours, bulls put end to it by setting hourly higher low. Friday closed within Thursday’s range after a failed break-out, which is a very bullish signal.
Currently, we have full alignment on all major timeframe: price is in uptrend on weekly, daily and hourly timeframes. There are absolutely no warning signs that would speak for bears.
Both short- and long-term outlooks are bullish. If you're already in a long position, you're fortunate and can rest easy. If you're considering entering the market, you can either wait for another pullback or enter now with a reasonable stop-loss.
FOMC minutes are coming out on Wednesday, which could cause some unexpected volatility. However, if there are no major surprises, the bullish thesis remains unchanged.
Disclaimer
I don't give trading or investing advice, just sharing my thoughts.


✅SPY WILL KEEP GROWING|LONG🚀
✅SPY is making a rebound
From the horizontal support
Of 524$ and as we are bullish
Biased we will be expecting
A further move up
LONG🚀
✅Like and subscribe to never miss a new idea!✅

SPY Summer PullbackThe recent low levels of liquidity may become more prevalent moving into the summer time as vacation time for many nears.
I am also waiting to hear the decision from the Bank Of Canada as well as other major banks around the world about the start of quantitative easing and lowering interest rates as soon as June.
The only problem with this, is the increasing value of the USD/DXY which may begin to strengthen against other currencies whom begin their devaluation.
Because the markets are generally measured relative to the dollar, a stronger DXY may provide the market with some downside in the summer months.
We do have some gaps (inefficiency) below at approx. 505-510 on the SPY. Interestingly or not , the golden 0.618 golden fib overlaps perfectly in these potential support zones.
I do not quite see the larger probability of a major market crash during an election year at the moment, and the longer term trend is still bullish.
Lets see how things play out

This will be the last rally SPY.SPY holding that 520 like god. They gonna rally test highs 533 it past that then we go 550 maybe. After that we should head down this time longer deeper. watch daily stoch turn up see how far it goes before turning. Why sell off
1. Rates are going higher u hear Bernstein saying inflation down 60% and 2% looks good target. WTF that why I play charts
2. Banks baby in trouble especially regionals other banks will fall also why debt man banks broke why they rally stock buy backs u understand that correct not productivity money to buy OWN shares back
3. Housing look XHB PHM housing about drop
4. IWM IWM has not yet and will not get to old highs that is bad bad.
5 breadth in market terrible
6 Watch fund managers sell into this rally get clients out.
so lets see next week we have SMH QQQ selling off to why inflation high rates
1 more high rates why banks dropping defaults not lending Jamie diamond announce no stock buy back may 23 look we dropped hard no stock buy back to expensive. National debt crazy. Lets see how next week goes. I am long SPXL 127.85
Thanks taking time read. Comments welcome.
