INTRADAY ascendinc triangle Monday close in break out, tuesday ascending triangle build in 3 session
Trade ideas

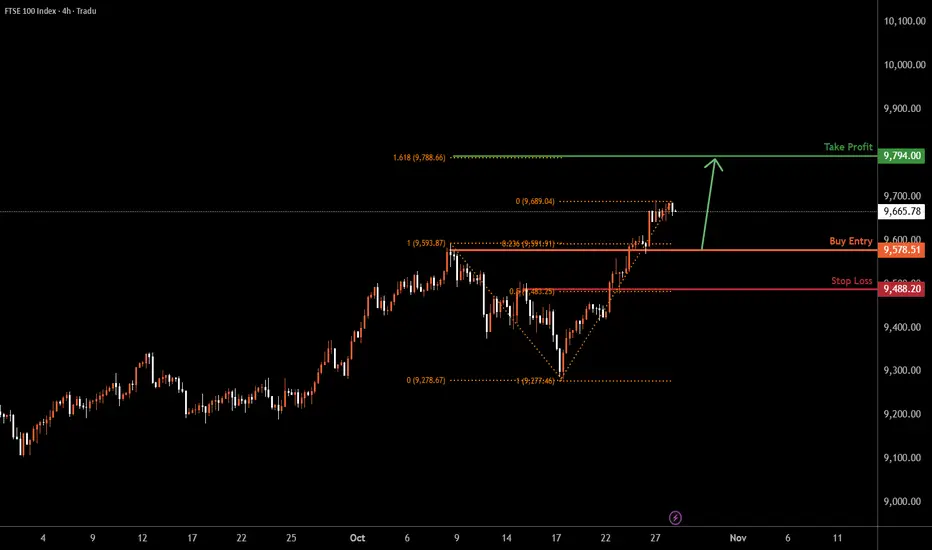
UK100 H4 | ullish Bounce off Pullback SupportUK100 is falling towards the buy entry, which is a pullback support that lines up with the 23.6% Fibonacci retracement and could bounce from this level to the upside.
Buy entry is at 9,578.51, which is a pullback support that aligns with the 23.6% Fibonacci retracement.
Stop loss is at 9,488.20, which is a pullback suport that aligns with the 50% Fibonacci retracement.
Take profit: 9,794.00, which is a resistance level that aligns with hte 161.8% Fibonacci extension.
Stratos Markets Limited (tradu.com):
CFDs are complex instruments and come with a high risk of losing money rapidly due to leverage. 68% of retail investor accounts lose money when trading CFDs with this provider. You should consider whether you understand how CFDs work and whether you can afford to take the high risk of losing your money.
Stratos Europe Ltd (tradu.com ):
CFDs are complex instruments and come with a high risk of losing money rapidly due to leverage. 70% of retail investor accounts lose money when trading CFDs with this provider. You should consider whether you understand how CFDs work and whether you can afford to take the high risk of losing your money.
FTSE100 overbought consolidation capped at 9770The FTSE remains in a bullish trend, with recent price action showing signs of a breakout within the broader uptrend.
Support Zone: 9646 – a key level from previous consolidation. Price is currently testing or approaching this level.
A bullish rebound from 9646 would confirm ongoing upside momentum, with potential targets at:
9770 – initial resistance
9800 – psychological and structural level
9845 – extended resistance on the longer-term chart
Bearish Scenario:
A confirmed break and daily close below 9646 would weaken the bullish outlook and suggest deeper downside risk toward:
9595 – minor support
9554 – stronger support and potential demand zone
Outlook:
Bullish bias remains intact while the FTSE holds above 9646. A sustained break below this level could shift momentum to the downside in the short term.
This communication is for informational purposes only and should not be viewed as any form of recommendation as to a particular course of action or as investment advice. It is not intended as an offer or solicitation for the purchase or sale of any financial instrument or as an official confirmation of any transaction. Opinions, estimates and assumptions expressed herein are made as of the date of this communication and are subject to change without notice. This communication has been prepared based upon information, including market prices, data and other information, believed to be reliable; however, Trade Nation does not warrant its completeness or accuracy. All market prices and market data contained in or attached to this communication are indicative and subject to change without notice.

FTSE breakout support at 9445The FTSE remains in a bullish trend, with recent price action showing signs of a breakout within the broader uptrend.
Support Zone: 9445 – a key level from previous consolidation. Price is currently testing or approaching this level.
A bullish rebound from 9445 would confirm ongoing upside momentum, with potential targets at:
9520 – initial resistance
9550 – psychological and structural level
9580 – extended resistance on the longer-term chart
Bearish Scenario:
A confirmed break and daily close below 9445 would weaken the bullish outlook and suggest deeper downside risk toward:
9406 – minor support
9383 – stronger support and potential demand zone
Outlook:
Bullish bias remains intact while the FTSE holds above 9445. A sustained break below this level could shift momentum to the downside in the short term.
This communication is for informational purposes only and should not be viewed as any form of recommendation as to a particular course of action or as investment advice. It is not intended as an offer or solicitation for the purchase or sale of any financial instrument or as an official confirmation of any transaction. Opinions, estimates and assumptions expressed herein are made as of the date of this communication and are subject to change without notice. This communication has been prepared based upon information, including market prices, data and other information, believed to be reliable; however, Trade Nation does not warrant its completeness or accuracy. All market prices and market data contained in or attached to this communication are indicative and subject to change without notice.

UK100 - TIME TO KILL Team, yesterday we did well with the AUS200 short position. couple of times.
Today we focus on SHORTING THE UK100 AT THIS LEVEL 9515-22
STOP LOSS at 9580
Target 1 at 9486-72 - TAKE PARTIAL 50-70%
Target 2 at 9465-56
NOTE: Once the price below 9492, bring stop loss to BE
lets go

FTSE 100 Outlook: Twin Bullish Signals Point to Fresh HighsFresh record highs for the FTSE 100 contract may be on the cards, with consecutive bullish signals pointing to growing upside risks.
The first arrived on Friday with a hammer candle on the daily chart, rebounding strongly after testing the 50-day moving average. That was followed on Monday by another large bullish bar that saw the price break out of the falling wedge pattern it had been trading in for much of the past month. The breakout points to the risk of further upside ahead, putting the record high of 9,579 set on October 8 on the menu for bulls.
Given the twin bullish signals, traders may want to consider initiating longs around these levels or slightly lower, targeting 9,485 or the record highs. Stop placement should reflect the desired risk-reward you’re seeking from the trade.
RSI (14) has broken its downtrend and now sits in marginally bullish territory. MACD also remains in positive territory despite crossing the signal line from above earlier this month and is now starting to flatten out. Combined, the two indicators suggest diminishing bullish momentum may be in the early stages of building again, improving the probability of the breakout playing out in full.
Good luck!
DS

FTSE 100 Wave Analysis – 20 October 2025
- FTSE 100 reversed from key support level 9330.00
- Likely to rise to resistance level 9600.00
FTSE 100 index recently reversed from the support area between the key support level 9330.00 (former strong resistance from August and September), 50% Fibonacci correction of the upward impulse from September and the lower weekly Bollinger Band.
The upward reversal from this support zone created the daily Japanese candlesticks reversal pattern Hammer.
Given the strong daily uptrend, FTSE 100 index can be expected to rise to the next resistance level 9600.00 (which stopped the previous impulse wave iii).

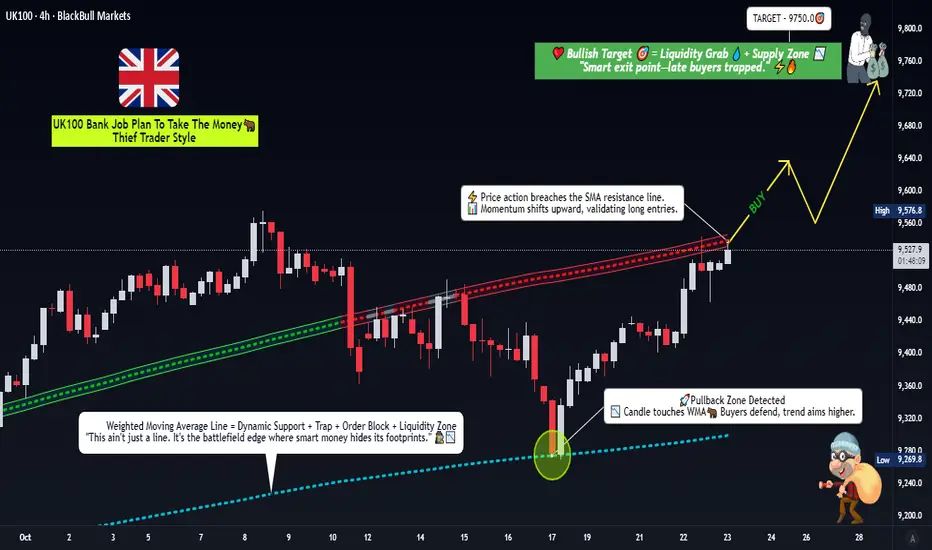
FTSE 100 Setup: Time to Go Long on This LSMA Breakout?🎯The UK100 "Capital Flow Heist" Blueprint 🚀 (Swing Trade Setup)
Buckle up, Thief Crew! 🏴☠️ We're plotting a bullish swing trade on the UK100, aiming to catch the next leg up. This isn't financial advice; it's a strategic blueprint for those who know how to handle the risk!
📈 The Master Plan (Analysis)
The strategy is simple: We're waiting for a confirmed bullish LSMA (Least Squares Moving Average) breakout to signal that the buyers are officially in control. This is all about timing the momentum shift and riding the wave.
⚙️ Trade Mechanics (The Heist Parameters)
Asset: UK100 (FTSE 100 Index)
Direction: Bullish
Style: Swing Trade
🎯 Entry Zone:
Action: Enter a LONG position on a confirmed candlestick close ABOVE the LSMA breakout level.
Level: 9560.0 (This is our launchpad! 🚀)
🛑 Stop Loss (The Escape Route):
Level: 9400.0
Thief's Note: This is my planned escape route. Place your SL where you are comfortable. Protect your capital like a pro! 💼
✅ Take Profit (The Loot Drop):
Level: 9750.0
Why Here? This zone represents a confluence of:
A strong historical resistance level.
Potential overbought conditions.
A classic bull trap area — so we grab our profits and exit stage left! 🎭
⚠️ Important Note from the OG: Dear Ladies & Gentlemen of the Thief Guild, I am not recommending you set only my SL or TP. It's your capital, your rules. You can make money, then take money at your own risk. Be a boss of your own trade. 😎
🔍 Related Pairs to Watch (The Intel)
To get a full picture, keep these assets on your radar. Movements here can influence our UK100 heist:
GBP/USD ( PYTH:GPUSD ): A stronger Pound can sometimes pressure the FTSE 100 (as many companies are multinational). Watch for inverse correlations.
US30 ($DOWI) / GER40 ( XETR:DAX ): Key global indices. Strong bullish moves in the US or German markets can often pull the UK market along for the ride.
EUR/GBP ( OANDA:EURGBP ): Economic dynamics between the UK and the Eurozone can cause capital flows in and out of UK assets.
✨ Final Community Message
“If you find value in my analysis, a 👍 and 🚀 boost is much appreciated — it helps me share more setups with the community!”
📜 Disclaimer & Hashtags
#UK100 #FTSE100 #TradingSetup #SwingTrading #TechnicalAnalysis #TradingView #CapitalFlow #ThiefStyle
LSE: Losing IPO Volume, Gaining Strategic AutonomyIn the third quarter, the London Stock Exchange dropped out of the top 20 global IPO markets for the first time in many years, ranking 23rd in the Bloomberg rating . This is an unexpected turn for an exchange that has long ranked among the world's leading venues for public offerings and attracted capital from across the globe for decades. In the current ranking, it was surpassed by the exchanges in Singapore, Mexico, and even Oman.
London may be losing IPO volume, but not control
At first glance, it may indeed seem that London is losing its influence. But if you look deeper, the root cause is that IPOs themselves have lost popularity in recent years: due to high interest rates, many companies preferred to postpone going public. According to EY reports by the end of 2024, the total number of global IPOs was 1215, compared to 1351 in 2023 .
Investors have also been cautious. In the current environment, it is pretty difficult to predict which companies going public will be successful and which will not. So, capital has been directed to other instruments. However, the situation is gradually changing: interest rates around the world are falling, opening a window of opportunity, especially for technology companies.
Britain's Post-Brexit Regulatory
Against this backdrop, each economy reacted in its own way. The UK decided not to wait for external conditions to improve, but to seize the moment to make systemic changes. After Brexit, the UK began to build its own regulatory system, independent of Brussels and Washington. The country effectively acknowledged that it would not be able to meet both European and American standards at the same time and decided to develop its own British model of regulation.
You might settle for a slice of a sprawling feast that doesn't suit your appetite. Or, you could prepare your own pudding-perhaps less grand, but crafted to your liking. London has embraced the pudding approach. This means that the United Kingdom understands that it is losing volume, but wants to build a system in which it sets the rules of the game and doesn’t have to contend with foreign bureaucracy. In the rankings this looks like a decline and a decrease in attractiveness, but what we are seeing here is a change of model. London remains an important center of capital, but its role now – to demonstrate autonomy.
So, why are some companies leaving the British market?
In fact, each company makes its own decision about where to go public, and it is not always because of bias against London. Unilever (LSE:ULVR), for example, is not leaving Britain at all. Post-Brexit, however, regulatory divergence made it impractical to maintain equal footing across both EU and UK frameworks. As a company with deep European roots, Unilever has designated Amsterdam as the primary listing for its ice cream division while retaining a secondary listing in London. This isn't a complete departure, its more like a strategic rebalancing that keeps London as part of its dual-listing structure, ensuring access to the U.S. and U.K. markets without full relocation.
In addition, the self-identification of companies also plays a role. Take, for example, the ESG agenda. Formally, it exists in both Europe and the UK, but even within this acronym (environmental, social, governance), the emphasis is different in different regions. For Europe, ESG is a mandatory part of any regulations with a strong focus on environmental friendliness. In the UK, the approach is more flexible, with greater attention paid to social issues in some areas.
That is why companies choose the market that is closer to their philosophy. Ultimately, this is not a question of London losing its appeal.
Asian markets are growing, but not forever
At the same time, there is no point in denying that the role of Asian markets is constantly growing. Over the past year, the total volume of IPOs in Asia has skyrocketed by 80%. Nevertheless, it seems that the prospects for these markets are now exaggerated a little bit.
Yet, this momentum follows a familiar historical pattern seen in several economies. Japan in the 1980s, South Korea in the 1990s, and China in the 2000s each experienced explosive export-led growth, only to face structural slowdowns as demographic pressures, rising debt, and shifting global trade dynamics took hold. The transitions weren't uniform or inevitable, but they do highlight recurring challenges in sustaining high growth over decades. Of course, we can single out Singapore with its adaptive management system and resilience, but it remains the exception rather than the rule. For this reason, we should continue to treat Asia with caution as a reliable engine of long-term stable growth.
In the short term, I would rather bet on Europe. For example, more and more companies are going public in Poland, while others are choosing Amsterdam and Stockholm. And this is just one of many examples of how European markets are quite capable of growing steadily. The main thing is not to give in to alarmist sentiments, but to look at any market calmly and without undue panic. London has certainly lost some of its IPO volume, but in my opinion, it should not be written off.


FTSE overbought corrective pullback support at 9646The FTSE remains in a bullish trend, with recent price action showing signs of a breakout within the broader uptrend.
Support Zone: 9646 – a key level from previous consolidation. Price is currently testing or approaching this level.
A bullish rebound from 9646 would confirm ongoing upside momentum, with potential targets at:
9770 – initial resistance
9800 – psychological and structural level
9845 – extended resistance on the longer-term chart
Bearish Scenario:
A confirmed break and daily close below 9646 would weaken the bullish outlook and suggest deeper downside risk toward:
9595 – minor support
9554 – stronger support and potential demand zone
Outlook:
Bullish bias remains intact while the FTSE holds above 9646. A sustained break below this level could shift momentum to the downside in the short term.
This communication is for informational purposes only and should not be viewed as any form of recommendation as to a particular course of action or as investment advice. It is not intended as an offer or solicitation for the purchase or sale of any financial instrument or as an official confirmation of any transaction. Opinions, estimates and assumptions expressed herein are made as of the date of this communication and are subject to change without notice. This communication has been prepared based upon information, including market prices, data and other information, believed to be reliable; however, Trade Nation does not warrant its completeness or accuracy. All market prices and market data contained in or attached to this communication are indicative and subject to change without notice.

FTSE bullish breakout support at 9646The FTSE remains in a bullish trend, with recent price action showing signs of a breakout within the broader uptrend.
Support Zone: 9646 – a key level from previous consolidation. Price is currently testing or approaching this level.
A bullish rebound from 9646 would confirm ongoing upside momentum, with potential targets at:
9770 – initial resistance
9800 – psychological and structural level
9845 – extended resistance on the longer-term chart
Bearish Scenario:
A confirmed break and daily close below 9646 would weaken the bullish outlook and suggest deeper downside risk toward:
9595 – minor support
9554 – stronger support and potential demand zone
Outlook:
Bullish bias remains intact while the FTSE holds above 9646. A sustained break below this level could shift momentum to the downside in the short term.
This communication is for informational purposes only and should not be viewed as any form of recommendation as to a particular course of action or as investment advice. It is not intended as an offer or solicitation for the purchase or sale of any financial instrument or as an official confirmation of any transaction. Opinions, estimates and assumptions expressed herein are made as of the date of this communication and are subject to change without notice. This communication has been prepared based upon information, including market prices, data and other information, believed to be reliable; however, Trade Nation does not warrant its completeness or accuracy. All market prices and market data contained in or attached to this communication are indicative and subject to change without notice.

FTSE 100 (UKX) | Targeting 17K → 23K → 50K The British Bull Awakens 🏴📈 | The British Bull Awakens 🏴📈 | The British Bull Awakens 🏴📈
Macro Wave 3 of SuperCycle 3 in full motion — 17K next, then 23K before Wave 4 reset and grand finale 50K .
The FTSE 100 is mid-way through its most powerful Elliott Wave phase in decades — Macro Wave (3) of SuperCycle (3).
A generational breakout is forming, with Fibonacci confluence and institutional flow pointing toward 17K and beyond. ⚡
🧩 The SuperCycle Map
📈 SuperCycle Wave (1) (1989–2000) → Globalization & tech boom = foundation of modern bull market.
📉 SuperCycle Wave (2) (2000–2009) → Dot-com + GFC reset the system with a 0.618 retrace.
⚡ SuperCycle Wave (3) (2009–Present) → Now in progress — a generational expansion wave unfolding.
Inside it:
Macro (1): 2009–2018 post-crisis recovery
Macro (2): 2018–2020 correction
Macro (3): 2020–Now → Targeting ~17,000
Macro (4): 2029–2033 est. → Retrace to 10–12K
Macro (5): 2033–2037 est. → Push to ~23,000
Then:
🌀 SuperCycle (4) = multi-year correction
🌟 SuperCycle (5) = grand finale toward ~50,000
💹 Wave Confluence & Fibonacci Geometry
2.618 extension → 17K (Macro 3 target)
3.618 extension → 23K (Macro 5 projection)
Historic 0.5–0.618 retraces at every cycle confirm proportional balance.
Long-term regression & wave symmetry both support this structure.
🧭 Smart Money & Market Structure
✅ Accumulation base: 7K–9K (institutional demand zones)
✅ Break of Structure (BoS) → confirmed expansion
✅ Fair Value Gaps below 9K → future liquidity magnets for Macro 4
✅ Continuous higher highs & order block footprints = Smart Money in control
📊 The FTSE remains in expansion phase , pushing through new structural highs as liquidity builds.
🌍 Macro Fundamentals
UK equities undervalued vs. global peers
Normalizing rates + disinflation = valuation tailwinds
Long-term flows into energy, AI, infrastructure
Institutional rotation into real assets supports the multi-decade rally
🎯 Targets Ahead
📍 Macro 3 (short-term): ~17,000
🔄 Macro 4 retrace: ~10–12K
🚀 Macro 5: ~23,000
🌀 SuperCycle 4 correction: multi-year base
🌟 SuperCycle 5: ~50,000
📈 This is the belief phase of a generational bull market — Macro Wave (3) within SuperCycle (3).
Patience now could pay off for decades.
💬 What’s your FTSE target — 17K, 23K, or 50K?
👇 Comment below and Follow for future wave updates & Smart Money confluence setups.
— Team FIBCOS
#FTSE100 #ElliottWave #SmartMoneyConcept #Fibonacci #WaveTheory #MarketStructure #MacroInvesting #TradingView #FIBCOS #BullMarket #Wave3 #PriceAction #UKX #Investing #MacroCycle

FTSE bullish breakout supported at 9550The FTSE remains in a bullish trend, with recent price action showing signs of a breakout within the broader uptrend.
Support Zone: 9550 – a key level from previous consolidation. Price is currently testing or approaching this level.
A bullish rebound from 9550 would confirm ongoing upside momentum, with potential targets at:
9706 – initial resistance
9740 – psychological and structural level
9800 – extended resistance on the longer-term chart
Bearish Scenario:
A confirmed break and daily close below 9550 would weaken the bullish outlook and suggest deeper downside risk toward:
9526 – minor support
9483 – stronger support and potential demand zone
Outlook:
Bullish bias remains intact while the FTSE holds above 9550. A sustained break below this level could shift momentum to the downside in the short term.
This communication is for informational purposes only and should not be viewed as any form of recommendation as to a particular course of action or as investment advice. It is not intended as an offer or solicitation for the purchase or sale of any financial instrument or as an official confirmation of any transaction. Opinions, estimates and assumptions expressed herein are made as of the date of this communication and are subject to change without notice. This communication has been prepared based upon information, including market prices, data and other information, believed to be reliable; however, Trade Nation does not warrant its completeness or accuracy. All market prices and market data contained in or attached to this communication are indicative and subject to change without notice.

UK100 Strategy Map: SMA Pullback Meets Heikin Ashi Signal🚀 UK100 Index Market Wealth Strategy Map (Swing/Day Trade)
📊 Plan
🔹 Bias: Bullish trend confirmed
🔹 Method: Simple Moving Average (SMA-382) pullback + bullish Heikin Ashi candle confirmation + Double bottom pullback detected.
🔹 Style: Thief layering strategy (multiple limit orders to build position)
🎯 Entry Plan
💡 Using layer entries (multiple limit orders) for flexibility:
Buy Limit @ 9220
Buy Limit @ 9230
Buy Limit @ 9240
Buy Limit @ 9250
👉 (Layers can be increased depending on market context — this is just my thief-style approach 🕵️)
🛡️ Stop Loss (Thief SL)
Protective Stop @ 9190
⚠️ Note: Dear Ladies & Gentlemen (Thief OG’s) — this is my style of SL. You can manage risk in your own way.
💰 Target
Exit Zone @ 9330 (near strong resistance + overbought area + possible trap zone)
⚠️ Note: Not financial advice — escape with profits when the market gives!
🔑 Thief Notes
This is my OG layering strategy — I don’t set rigid SL/TP rules for everyone. Manage your own risk 💼.
Goal: Catch the swing, ride the bullish confirmation, and exit before trap levels lock profits.
🌍 Related Pairs to Watch
Because UK100 often correlates with global indices & USD movements:
FOREXCOM:SPX500 (US equities correlation, risk sentiment driver)
GOMARKETS:DAX40 (European equity benchmark, strong correlation with UK100)
FX:USDJPY (risk-on/risk-off sentiment gauge)
FX:GBPUSD (pound strength can influence UK equities indirectly)
Watching these helps confirm whether the UK100 move is supported by broader market flows 📈🌐
✨ “If you find value in my analysis, a 👍 and 🚀 boost is much appreciated — it helps me share more setups with the community!”
⚠️ Disclaimer: This is the Thief Style Trading Strategy — created for fun & educational purposes only. Not financial advice. Trade at your own risk.
#UK100 #FTSE100 #IndexTrading #SwingTrade #DayTrading #HeikinAshi #SMA #ThiefStrategy #SPX500 #DAX40 #GBPUSD #USDJPY #TradingCommunity

FTSE Bullish breakout supported at 9490The FTSE remains in a bullish trend, with recent price action showing signs of a breakout within the broader uptrend.
Support Zone: 9490 – a key level from previous consolidation. Price is currently testing or approaching this level.
A bullish rebound from 9490 would confirm ongoing upside momentum, with potential targets at:
9600 – initial resistance
9650 – psychological and structural level
9700 – extended resistance on the longer-term chart
Bearish Scenario:
A confirmed break and daily close below 9490 would weaken the bullish outlook and suggest deeper downside risk toward:
9465 – minor support
9440 – stronger support and potential demand zone
Outlook:
Bullish bias remains intact while the FTSE holds above 9490. A sustained break below this level could shift momentum to the downside in the short term.
This communication is for informational purposes only and should not be viewed as any form of recommendation as to a particular course of action or as investment advice. It is not intended as an offer or solicitation for the purchase or sale of any financial instrument or as an official confirmation of any transaction. Opinions, estimates and assumptions expressed herein are made as of the date of this communication and are subject to change without notice. This communication has been prepared based upon information, including market prices, data and other information, believed to be reliable; however, Trade Nation does not warrant its completeness or accuracy. All market prices and market data contained in or attached to this communication are indicative and subject to change without notice.

FTSE: hunt on previous highs. An excellent set-up with FTSE sweeping the weekly internal range liquidity first before aiming for external range above. Daily RSI support the trade along with bullish divergence. Text-book.

UK100 - WE DO IT AGAINTeam, yesterday we successfully booked the profit on UK100, hit our 1st target
Today we are re-shorting range at 9540-9565 - with stop loss at 9610
Target 1 at 9515-9506 TAKE PARTIAL and bring stop loss to the ENTRY LEVEL
Target 2 at 9486-9472
LETS GO AND KILL THE BEAST.

FTSE oversold rally supported at 9350The FTSE remains in a bullish trend, with recent price action showing signs of a breakout within the broader uptrend.
Support Zone: 9350 – a key level from previous consolidation. Price is currently testing or approaching this level.
A bullish rebound from 9350 would confirm ongoing upside momentum, with potential targets at:
9440 – initial resistance
9460 – psychological and structural level
9490 – extended resistance on the longer-term chart
Bearish Scenario:
A confirmed break and daily close below 9350 would weaken the bullish outlook and suggest deeper downside risk toward:
9330 – minor support
9308 – stronger support and potential demand zone
Outlook:
Bullish bias remains intact while the FTSE holds above 9350. A sustained break below this level could shift momentum to the downside in the short term.
This communication is for informational purposes only and should not be viewed as any form of recommendation as to a particular course of action or as investment advice. It is not intended as an offer or solicitation for the purchase or sale of any financial instrument or as an official confirmation of any transaction. Opinions, estimates and assumptions expressed herein are made as of the date of this communication and are subject to change without notice. This communication has been prepared based upon information, including market prices, data and other information, believed to be reliable; however, Trade Nation does not warrant its completeness or accuracy. All market prices and market data contained in or attached to this communication are indicative and subject to change without notice.

FTSE corrective pullback support at 9265Support Zone: 9265 – a key level from previous consolidation. Price is currently testing or approaching this level.
A bullish rebound from 9265 would confirm ongoing upside momentum, with potential targets at:
9382 – initial resistance
9424 – psychological and structural level
9442 – extended resistance on the longer-term chart
Bearish Scenario:
A confirmed break and daily close below 9265 would weaken the bullish outlook and suggest deeper downside risk toward:
9247 – minor support
9230 – stronger support and potential demand zone
Outlook:
Bullish bias remains intact while the FTSE holds above 9265. A sustained break below this level could shift momentum to the downside in the short term.
This communication is for informational purposes only and should not be viewed as any form of recommendation as to a particular course of action or as investment advice. It is not intended as an offer or solicitation for the purchase or sale of any financial instrument or as an official confirmation of any transaction. Opinions, estimates and assumptions expressed herein are made as of the date of this communication and are subject to change without notice. This communication has been prepared based upon information, including market prices, data and other information, believed to be reliable; however, Trade Nation does not warrant its completeness or accuracy. All market prices and market data contained in or attached to this communication are indicative and subject to change without notice.

Price Action Key for FTSE 100With momentum indicators generating neutral signals and the price resting on support, there are numerous two-way trades to consider in the FTSE 100 contract.
9360 is the level to watch in the short term, coinciding with the high set on August 22. Since being established, it has provided resistance and support, making it a decent level to build setups around.
If we see a clean break beneath 9360, shorts could be established below the level with a tight stop above for protection, targeting either 9315 (the intersection of former triangle resistance and wedge support), the 50-day moving average at 9271, or 9200, depending on the desired risk-reward you’re seeking from the trade.
Alternatively, if the price manages to reclaim 9360 and hold there, the setup could be flipped, allowing for longs to be established above with a stop below for protection. Given the falling wedge pattern the contract finds itself coiling in, convention suggests that if we see a break of downtrend resistance around 9440 today, it could see the price revisit the swing high of 9579 set earlier this month. Resistance at 9485 provides another option for those seeking less from the setup.
There is no firm directional signal from either RSI (14) or MACD, sitting in either neutral territory or indicating waning bullish strength. Price action should therefore take precedence when it comes to trade selection.
Good luck!
DS

FTSE corrective pullback supported at 9365The FTSE remains in a bullish trend, with recent price action showing signs of a breakout within the broader uptrend.
Support Zone: 9365 – a key level from previous consolidation. Price is currently testing or approaching this level.
A bullish rebound from 9365 would confirm ongoing upside momentum, with potential targets at:
9490 – initial resistance
9518 – psychological and structural level
9550 – extended resistance on the longer-term chart
Bearish Scenario:
A confirmed break and daily close below 9365 would weaken the bullish outlook and suggest deeper downside risk toward:
9340 – minor support
9307 – stronger support and potential demand zone
Outlook:
Bullish bias remains intact while the FTSE holds above 9365. A sustained break below this level could shift momentum to the downside in the short term.
This communication is for informational purposes only and should not be viewed as any form of recommendation as to a particular course of action or as investment advice. It is not intended as an offer or solicitation for the purchase or sale of any financial instrument or as an official confirmation of any transaction. Opinions, estimates and assumptions expressed herein are made as of the date of this communication and are subject to change without notice. This communication has been prepared based upon information, including market prices, data and other information, believed to be reliable; however, Trade Nation does not warrant its completeness or accuracy. All market prices and market data contained in or attached to this communication are indicative and subject to change without notice.

Trendline break The price has broken out of a bearish trendline which was a consolidation as the price is still in a bullish trend, the price now looks to make a small pullback then, we expect a bullish impulse
WE ONLY TRADE PULLBACKS
Comment your thoughts
