US 10Y TREASURY a 25bps cut – decision weekSeptember's PCE data came just a bit lower than anticipated. The data showed inflation at 2,8%, while the market was expecting a figure of 2,9%. Easing inflation heated market expectations that the Fed will cut interest rates by 25 basis points at their meeting on Wednesday, December 10th. Odds for a rate cut currently stand at 87%. The 10Y Treasury yields turned to the upside during the previous week, after testing support at 4,0%. The highest weekly level of 4,14% was reached at Friday's trading session.
The week ahead is the FOMC week. Fed Chair Powell is expected to address the public after the FOMC meeting. Markets will be able to hear the latest update on the state of the US economy, as perceived by Fed members. Thai is the time when market volatility significantly increases, as well as volatility in US Treasury yields. In this sense, the level of 4,16% might easily be the next target for 10Y yields. Also, some relaxation toward the 4,06% might also be possible.
US Government Bonds 10 YR Yield
No trades
Trade ideas

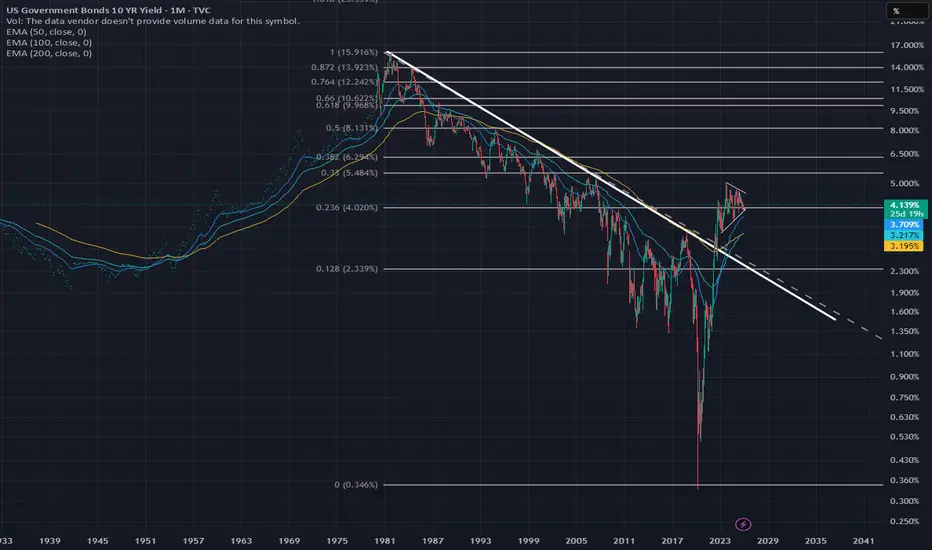
10 Year Yield primed for explosive break outAs the Japanese carry trade unwinds with BOJ having no alternative than to raise rates after decades of real negative rates we expect over 1.3 trillion dollars of Japanese holdings of US treasuries to hit the market along with another 800 Billion Chinese holdings. The 10 Year note is consolidating in a pennant formation which indicates yields rising to a minimum of 10% but chances of rising to 16% to completely retrace the corrective decline. Nasdaq reaches its 55 year Fibonacci run in February 2026. Expect decimation of US Markets and Housing Market.
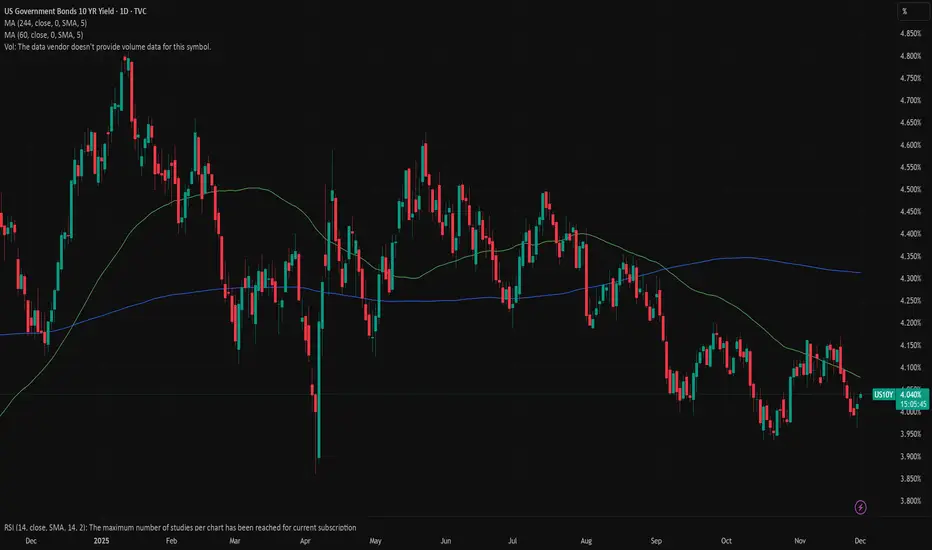
US 10Y TREASURY: aligning to a Feds cutWeaker inflation and economic output data increased investors sentiment of a potential Fed rate cut at December's FOMC meeting. The 10Y US Treasury benchmark yields reacted to these expectations, pushing yields further to the lower side. The 10Y yields started the week around 4,04%, but reached the lowest weekly level at Friday's trading session, at 3,96%. Still, they closed the week at 4,01%.
Although yields are holding around the 4%, still next Friday might bring some higher volatility, as September PCE data are set for a release. This indicator represents Fed's favourite inflation gauge, in which sense, the market might increase its nervousness, in case that posted figures are not in favour of Fed's 25 basis point cut. On the other hand, yields might continue to be in a “silent” mode, around 4%, prior to the FOMC meeting, scheduled in two weeks from now.
10 Year 2.4% 2028-2029 10 Year Yields
Using a double curve and a flipped forecast to track this. 2028-2029 yields could be around 2.4%
fed funds in blue
points used dashed lines to market it
3/6/20
12/20/21
11/1/22
1/14/25
keep in mind this can change depending on the global economy and macro events

The Bond Markets Effect on the Stock MarketThe trend shown here is what helped me derisk prior to sustained market pullbacks seen during the Covid crash and in early 2022. When the 10Y rises sharply, the stock market usually pulls back in the days / weeks to follow. The major 10Y trend can be seen in my previous post which uses the blue lines shown here to show the large wedge that is forming. Right now we are bottoming on this wedge again and forming an upside down Head and Shoulder pattern. I believe we will have a Santa crash this year instead of a Santa rally if the 10Y breaks out of this pattern and continues to climb higher. AMEX:SPY TVC:US10Y FOREXCOM:SPX500 NASDAQ:NVDA NASDAQ:QQQ

1 Day candle still at breakoutLooking at this point XAUUSD still strong as we see from the chart. Daily have break out from small rectangular shape. DXY & US10Y looking like double top.

Economic Future at Risk in the Trading Market1. Heightened Market Volatility and Unpredictability
Market volatility is not new, but its frequency, magnitude, and drivers have changed. Previously, volatility was largely triggered by economic data or company earnings. Today, geopolitical shocks, pandemic-like events, cyber-attacks, and supply chain breakdowns trigger sudden movements across global markets.
High-frequency trading algorithms and automated systems amplify these movements. A minor headline can trigger billions of dollars in buying or selling within seconds, resulting in flash crashes or sharp intraday swings. This makes the trading environment more dangerous for retail traders and institutions, raising the probability of mispricing, liquidity traps, and cascading sell-offs.
2. Central Bank Tightening and the Threat of Economic Slowdown
The last decade was marked by cheap money—near-zero interest rates and quantitative easing. But inflationary pressures following the pandemic, supply chain shortages, and geopolitical tensions forced central banks (like the U.S. Federal Reserve, ECB, and RBI) to raise interest rates aggressively.
Higher interest rates bring several risks:
Reduced liquidity in equity and bond markets
Corporate borrowing costs rise, leading to lower earnings
Emerging markets face currency pressure as capital flows back to the U.S.
Real estate and financial assets lose valuation
Higher chance of recession
In a high-rate environment, every asset class—stocks, crypto, gold, bonds, real estate—faces pricing uncertainty. Traders must adapt to a world where liquidity is shrinking and capital is more expensive.
3. Geopolitical Instability Rewriting Global Trade
The global economy is undergoing a major geopolitical realignment:
The U.S.–China rivalry is disrupting technology supply chains.
Conflicts in Europe, Middle East, and Asia threaten fuel and food supplies.
Countries are prioritizing economic nationalism, reshoring factories and reducing trade dependencies.
These shifts raise costs for companies and slow down global economic growth. Markets react violently to geopolitical shocks—especially commodity markets like oil, gas, wheat, and rare earth metals. For traders, this means higher uncertainty, sudden price gaps, and the constant threat of new sanctions or regulations.
4. Currency Instability and the Fight for Dominance
Global currency markets face major instability:
The U.S. dollar is strong, creating pressure on emerging market currencies.
Multiple countries are exploring de-dollarization, challenging the global currency order.
Large nations are increasing their reserves of gold, signaling declining trust in fiat systems.
Cryptocurrencies continue rising but remain highly volatile.
When currencies fluctuate rapidly, it affects trade balances, government debt, import/export costs, and corporate earnings. Multinational companies face higher hedging costs. Investors face exchange-rate risks. For developing economies, the risk of capital flight increases, putting their economic future at risk.
5. Debt Crisis Looming Over Countries and Corporations
Global debt—government, household, and corporate—has reached historically extreme levels. Many countries borrowed heavily during the pandemic to support their economies. Now, with higher interest rates, repayment burdens are rising.
Countries at risk include:
Highly indebted developed nations
Emerging markets dependent on foreign loans
Economies struggling with weak exports or falling currency reserves
A debt default or liquidity crisis in one major economy could trigger global contagion, as seen in the 2008 financial crisis. Corporate debt is another danger—many companies now face refinancing at significantly higher interest rates, which could push weaker firms toward bankruptcy.
6. Technology Disruption, Cyber Risks, and AI-Driven Trading
Technology has always shaped finance, but today’s disruption is unprecedented:
AI-driven trading
Algorithms dominate global trading volumes, making markets move faster and sometimes more irrationally. Errors, bugs, or miscalculations in algorithms can cause massive volatility.
Cyber-attack risks
Financial markets are prime targets for cyber warfare. A major breach on a stock exchange, bank, or clearinghouse could disrupt global markets instantly.
Blockchain instability
Crypto markets add another layer of uncertainty, with regulatory crackdowns, exchange failures, and price manipulation affecting investor confidence.
While technology brings efficiency, it also introduces systemic fragility, where one failure can ripple across markets.
7. Commodity Shock Risks: Energy, Metals, and Food
Commodity markets are extremely sensitive to global shocks:
Oil and gas supply disruptions raise costs worldwide.
Climate change affects crop yields, increasing food prices.
Rare earth and metal shortages disrupt technology and electric vehicle industries.
When commodities spike, inflation rises. When they crash, exporting nations suffer revenue losses. Both extremes create economic instability, affecting stock markets, currency markets, and global trade.
8. Climate Change and the Cost of Environmental Disasters
Climate risks are now financial risks. Extreme weather events—floods, droughts, heatwaves, storms—directly impact national economies and trading markets:
Agricultural output drops
Insurance costs surge
Supply chains break
Infrastructure is damaged
Energy demands rise
Climate-related losses already cost trillions globally. As environmental disasters increase, financial assets that depend on stability become more vulnerable.
9. Social and Political Instability Threatening Economic Confidence
Economic inequality, unemployment, and inflation often lead to social tensions. Political unrest can weaken investor confidence, reduce foreign investment, and derail economic growth. Countries facing internal instability often see:
Capital outflows
Currency depreciation
Stock market decline
Increased borrowing costs
Such scenarios make long-term planning difficult for traders and investors.
10. Psychological and Behavioral Risks in Trading
Human behavior plays a crucial role in market dynamics. The modern era has amplified emotional trading:
Social media influences market sentiment
FOMO-driven trading causes bubbles
Panic selling creates flash crashes
Retail traders follow trends without risk management
This irrational behavior increases systemic vulnerability. When millions follow the same emotional trend, markets lose stability.
Conclusion: Navigating a Future Filled With Risk
The economic future is undeniably at risk due to converging forces: geopolitical conflict, technology disruption, debt burdens, climate change, currency instability, and behavioral volatility. The trading market reflects these tensions in the form of rapid price swings, liquidity shocks, and unpredictable cycles.
However, risks also create opportunities. Traders and investors who focus on diversification, risk management, macro insights, and disciplined strategy can thrive even in turbulent times. The key is understanding that the future will not resemble the stability of previous decades. Instead, success depends on adapting to a world defined by uncertainty, speed, and global interconnectedness.
Digital Dominates the Market & Old Methods Fall Behind1. Digital Transformation: Speed, Scalability, and Efficiency
Digital systems offer lightning-fast operations that traditional methods cannot match.
Where old systems depend on manual processes, paperwork, or physical presence, digital models operate instantly across the globe.
Speed
Transactions take seconds, from online banking to e-commerce checkout.
Supply chain decisions update in real time through sensors and AI dashboards.
Digital communication—emails, messaging, cloud collaboration—moves faster than traditional mail, memos, or in-person coordination.
Old methods, built on slower bureaucratic workflows, lose relevance when consumers and businesses expect instant outcomes.
Scalability
Digital platforms scale globally with minimal marginal cost.
A software company can serve millions without building new factories, whereas traditional businesses must invest heavily in infrastructure to grow.
This is why:
Digital streaming beats physical CDs and DVDs.
Online education reaches millions vs. classroom limits.
E-commerce expands without opening new stores.
Traditional models built around physical capacity struggle to expand at the same pace.
2. Data: The New Competitive Advantage
In the digital marketplace, data is the new oil—but more importantly, it becomes actionable instantly through analytics and AI.
How Digital Uses Data
Customer behavior tracking enhances precision marketing.
AI models predict demand, optimize pricing, and improve logistics.
Businesses personalize product recommendations—a feature impossible with old marketing tools.
Traditional methods like:
manual customer surveys,
limited market studies,
guess-based advertising,
cannot provide the accuracy or real-time insights needed for modern competition.
Because digital systems learn and adapt continuously, they grow more efficient over time, while old methods remain static.
3. Digital Consumer Behavior: Convenience Wins
Digital dominates markets because consumers have shifted online. Convenience is king.
What consumers now prefer:
Online shopping with home delivery
Digital payments over cash
OTT streaming over cable TV
Mobile banking over in-branch visits
Ride-hailing apps over traditional taxis
Food delivery apps over calling restaurants
Old methods fail because they require more effort, more time, and often more cost.
The demand for personalization
Algorithms tailor:
ads,
shopping experiences,
search results,
content recommendations.
Traditional one-size-fits-all approaches—newspapers, radio, physical catalogs—cannot match personalized digital experiences.
4. Automation and AI: Replacing Manual Workflows
Automation is a central reason digital dominates.
AI, machine learning, and robotic process automation reduce errors and costs while increasing throughput.
Digital automation examples:
Chatbots replacing customer service centers
AI underwriting replacing manual loan officers
Algorithmic trading outperforming human traders in speed
Robotic assembly lines increasing manufacturing efficiency
Smart warehouses with automated inventory systems
Old methods relying on manual labor or human-only operations lag because they are costly, slow, and prone to inconsistency.
5. Platform Economies Beat Traditional Business Models
Digital platforms like Amazon, Uber, Airbnb, and Google transformed markets by connecting millions of users through online ecosystems.
Advantages of digital platforms:
Zero inventory models (e.g., Uber owns no cars)
Low cost per additional user
Global user networks
Winner-take-all dynamics powered by data
Traditional industries with fixed assets, limited reach, and physical infrastructure cannot compete with the platform model’s efficiency.
6. Marketing: Digital Ads Crush Traditional Advertising
Advertising is one area where the shift is most obvious.
Digital marketing benefits:
performance tracking,
precise targeting,
retargeting,
demographic insights,
cost efficiency.
Platforms like Google Ads, Facebook Ads, and Instagram Reels allow businesses to reach exact audiences.
By contrast:
print ads,
billboards,
radio,
TV commercials
provide no precise data on who viewed or acted on the message.
Thus, traditional marketing budgets shrink every year as businesses migrate to digital channels.
7. Digital Finance & Payments Overtake Cash-Based Systems
FinTech has become one of the biggest disruptors.
Digital finance innovations such as:
UPI
e-wallets
algorithmic credit scoring
digital lending
automated KYC
blockchain transactions
are outcompeting traditional banking models.
Old cash-heavy methods or manual paperwork-based banking slow down transactions, increase risk, and limit accessibility.
Digital finance, being efficient, borderless, and transparent, dominates modern monetary flows.
8. E-Commerce and the Fall of Traditional Retail
E-commerce has redefined how people shop.
Digital advantages:
24/7 availability
more product variety
faster price comparison
personalized recommendations
doorstep delivery
easy returns and refunds
Traditional retail, despite offering physical experience, struggles with:
limited store hours,
higher operational costs,
smaller inventory,
regional restrictions.
Digital-first retailers with online-only models take the lead.
9. Remote Work & Cloud Systems Replace Traditional Office Models
The digital workplace has become dominant.
Digital tools:
Zoom, Google Meet
Slack, Teams
Cloud storage
Virtual project management tools
enable businesses to collaborate without needing physical offices.
Old workplaces requiring physical presence are falling behind due to:
higher real estate costs,
long commutes,
reduced flexibility.
Digital work increases productivity and widens talent pools globally.
10. Innovation Cycles: Digital Evolves Faster
Digital technology evolves at breakneck speed.
Every year brings:
faster processors,
smarter algorithms,
new apps,
improved networks,
enhanced automation.
Traditional industries, requiring physical upgrades, machinery, or labor restructuring, cannot update at the same pace.
Thus, over time, digital companies innovate exponentially while old industries evolve linearly—creating an ever-widening gap.
Conclusion: The Digital Wins Because It Is Faster, Smarter, Cheaper, Global
Digital methods dominate because they:
scale rapidly,
rely on data,
adapt through AI,
offer personalization,
reduce cost,
improve convenience,
operate globally with minimal friction.
Old methods fall behind because they:
depend on slower manual workflows,
require physical presence,
lack real-time data,
cannot personalize experiences,
involve higher costs and limited reach.
In today’s hyperconnected world, digital is not just an alternative—it is the primary driver of global markets. Old methods still exist, often for tradition or regulatory reasons, but their influence continues to shrink. The future belongs to systems that can evolve quickly, use data intelligently, and meet consumers’ expectations for instant, frictionless service. Digital does all this—and more—ensuring it remains the dominant force shaping the global economy.
US10Y - move downAt the end of October 2023, we finished the upward move and entered a correction phase.
The higher-level corrections are coming to an end, and in the medium term a deeper move downward is expected.
For a short period, we may still see some upside (or fluctuations) within the correction, but compared to the main move, it will be insignificant.
The reference level is around 2,770 .
---
Please subscribe and leave a comment.
You’ll get new information faster than anyone else.
Together, we’ll grow and become wealthier.
---

Crash / Clear Recession (Confirmed Later)??? or Mild RecessionI have Labeled all the phases in Color Coded lines
The color of the lines is tied to Equities and their "current stance" during the time period.
Each colored line is also labeled with the ( 10 Year - 2 Year Yield Curve ) Cycle for the time period.
I label at the current date the two possible situations going into 2026

Rising 10_Yields Ahead?Here’s How It Could Hit BTC, Gold, StocksWhy the US 10-Year Yield Matters
The US 10-Year Treasury yield is one of the most important benchmarks in global finance. It reflects investor expectations for inflation, growth, and Federal Reserve policy. Because it influences everything from mortgage rates to equity valuations and the strength of the US dollar( TVC:DXY ), understanding its direction helps traders anticipate major market shifts.
Key Scenarios to Watch
1. Yield Rising (Bullish Yield / Bearish Bonds)
Signals stronger economic expectations or sticky inflation.
Usually pushes the USD higher and puts pressure on risk assets like tech stocks and crypto.
Markets begin pricing fewer rate cuts or even potential tightening.
2. Yield Falling (Bearish Yield / Bullish Bonds)
Indicates rising recession risk, softer inflation, or expectations of Fed rate cuts.
Supports equity markets and risk assets (including crypto).
Typically weakens the US dollar.
3. Sideways / Stable Range
Suggests economic uncertainty or balanced expectations.
Markets remain in consolidation until new macro data or Fed signals arrive.
Why Traders Follow It:
Small moves in the 10-year yield can shift global liquidity, risk sentiment, and currency flows — making it a core indicator for forecasting market direction.
Given the current data and signals, my short-term forecast is for yields to remain flat or move slightly higher, but the likelihood of a significant decline in the near term seems slim.
-----------------------------------------------------
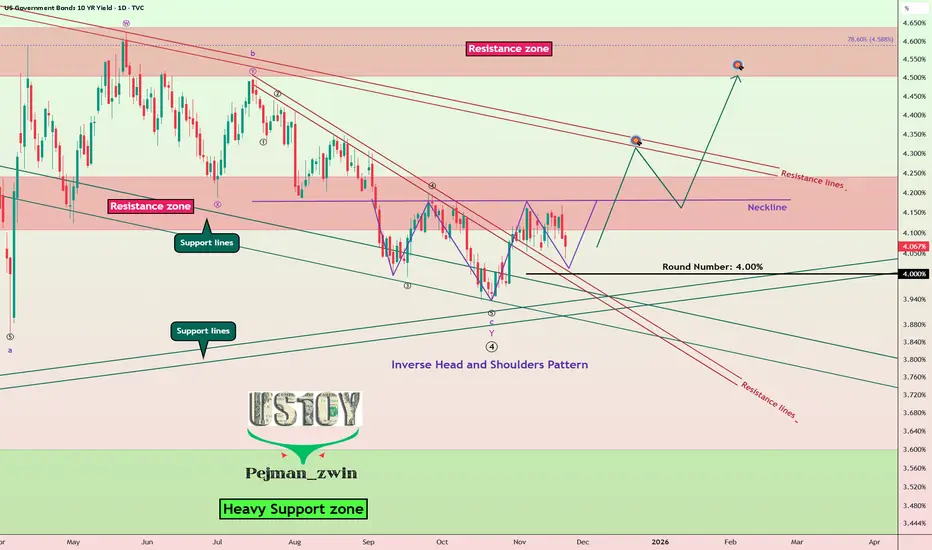
Now let's take a look at the US 10-Year Government Bond Yield chart on the daily time frame.
The US 10-Year Government Bond Yield is currently moving near the support lines and the 4.00% (Round Number).
In terms of classic technical analysis, we can expect that the US 10-Year Government Bond Yield's uptrend could start with an Inverse Head and Shoulders Pattern.
In terms of Elliott Wave theory, it appears that the US 10-Year Government Bond Yield has succeeded in completing the main wave 4 with a Double Three Correction(WXY).
I expect the US 10-Year Government Bond Yield to attack Resistance lines after breaking the Neckline and Resistance zone(4.24%-4.14%).
-----------------------------------------------------
Impact of a Rising US 10-Year Yield
•Bitcoin( BINANCE:BTCUSDT ):
A higher 10-year yield usually reduces liquidity and increases funding costs, which puts pressure on risk assets. BTC typically faces short-term downside or slower momentum when yields rise.
•Gold( OANDA:XAUUSD ):
Gold often moves inversely to yields. Rising yields increase the opportunity cost of holding gold, making it less attractive. This usually leads to weakness or consolidation in gold.
•Stocks (Equities):
Higher yields tighten financial conditions and lower valuations, especially for tech and growth stocks. Equities generally face selling pressure when yields rise sharply.
If you would like to see technical analysis on the weekly timeframe, I recommend you take a look at the link below.👇
-----------------------------------------------------
💡 Please respect each other's opinions and express agreement or disagreement politely.
📌US 10-Year Government Bond Yield Analyze ( TVC:US10 ), Daily time frame.
🛑 Always set a Stop Loss(SL) for every position you open.
✅ This is just my idea; I’d love to see your thoughts too!
🔥 If you find it helpful, please BOOST this post and share it with your friends.
US 10Y TREASURY: Holds tight rangeDuring the previous period markets were moving based on sentiment, considering that official macro data were not at disposal. The first data were posted during this week, showing relatively mixed signals for the jobs market. The NFP added 119K new jobs in September, surpassing market estimates of only 50K. On the other hand, the US unemployment rate has risen to 4,4% in September, from 4,3% previously. The 10Y benchmark yields were moving between 4,16% and 4,06%. Friday brought another push toward the 4,03% after New York Fed President John Williams commented on a possibility of a rate cut in December.
Markets continue to target the 4,0% support level for 10Y yields. This level will remain in focus during the week ahead. The PPI and PCE are scheduled to be released in the week ahead, which might bring some higher volatility. Also, November 27th is a holiday in the US, when markets will be closed. At this moment, charts are suggesting the higher probability of side trading in 10Y yields, again between 4,0% and 4,1% levels.

UST 10Y OUTLOOK FOR THE WEEK NOV 34-28
UST 10Y OUTLOOK FOR THE WEEK NOV 34-28
The US 10-year Treasury yield closed the prior week at ~4.06%, down sharply on dovish comments from NY Fed President John Williams supporting a potential December rate cut. Market-implied odds for a 25bps Fed cut on Dec 9–10 have rebounded to >50% (from lows near 30–40% earlier in the week), driven by softening labor signals and heightened uncertainty. Key data this holiday-shortened week includes flash PMIs (Mon), advance GDP Q3 revision & durable goods (Wed), and PCE inflation (Thu, released early due to Thanksgiving). Consensus expects benign PCE (~2.3% core YoY), which could reinforce cut pricing and push yields lower toward 4.00% if soft, or stabilize/rebound if hotter-than-expected. Thanksgiving liquidity thinning may exaggerate moves, but overall fundamentals lean mildly bullish for bonds (lower yields) unless data surprises hawkishly.
Key Economic Data for the Week
www.myfxbook.com
Weekly Outlook
With a strong bearish push on yield closing Friday, Nov 21 (bullish in price), I am anticipating 4.036% target for the week. Yield could retrace back to 4.1% before it tries to push lower. With a shortened week due to thanks giving holiday market could also stay on a narrow range this week. Key levels for the week 4.1%, 50% retracement level of last week's range and 4.036% previous week low.

EUR/USD long: Expect volatility leading up to US NFP dataHello traders
I have closed my EUR/USD short for a 63 pip profit.
I have initiated a long EUR/USD position at 1.1583 with a stop at 1.1560.
The USA NFP data on Thursday is guaranteed to create volatility for the rest of the week.
TECHNICAL:
EUR/USD is holding steady above a weekly close level.
GOLD is also steady above the weekly close of 4000/oz
DXY is below a weekly close and formed a Doji candle yesterday. If tomorrow's close is lower, it will be an evening star pattern.
US Government Bonds 10Y Yield is close to the third touch on a downtrend line
BTC is recovering from matching the 1/1/2025 monthly low at 89,000
FUNDAMENTAL:
Uncertainty rules but there are some bright spots. The Trump administration has rolled back tariffs on food items not produced in the USA. Coffee beans (duuhhhh...) but thanks for your beautiful Kona beans, Hawaii.
Tomatoes(bulk imported from Mexico and Canada)
Bananas... like his tariff spree
The US Supreme Court decision on the legality of the tariffs may land sooner than later.
Most important in my opinion: The election results in an off-year. Barring special elections, the results show that America is pissed off. He promised lower inflation, food and gas prices, the end to the Ukraine/Russia war, release of the Epstein files(probably happening tomorrow but wait for the twist, just like his tax returns that are still under audit by the IRS... LOL.) My bet is that the DOJ will announce that not all files can be released due to an ongoing investigation into, yes, Democrats.
All these broken promises and chaos must weigh on international investors decisions on the continued sensibility of investing in the USA.
Longer term I am not too concerned about that theme but it remains to be seen what the totality of the damage he has and will inflict on the USA as a leader on many fronts will be.
Private sector job reports for September show:
ADP: 42,000 jobs added
Challenger: 54,000 job cuts
Bank of America internal data: Steady wage growth but slow down in hiring and likely increased unemployment rate.
CME Fedwatch tool shows a 46% probability of a rate cut in December. It is updated every 24 hours.
Lots of jaw boning from FOMC members.
Jefferson: we should wait
Waller: A preemptive cut will be in order.
Miran(Trump's buddy): cut, cut cut.
Hassett (Senior Administration Economic Adviser): the labor market is in "quiet time" due to AI efficiency (as the AI trade is softening). Yeah...
Folks, thanks for reading, IF you had made it this far.
Best of luck.

US 10Y TREASURY: Fed might (not) cut in DecemberThe US Treasuries were moving in a swing manner during the previous week. The 10Y US benchmark reached the lowest weekly level at 4,05%, but ended the week at 4,18%. The US Government ended its longest “shutdown” in history, however, there is some indication that the macro data for the “shutdown” period will probably not be released. Investors are attempting to assess the health of the US economy amid a lack of fresh data and uncertainty about policy direction. The pause in key statistics has left markets navigating with less clarity about growth and inflation prospects. As per CME FedWatch Tool there is currently around 50% chance that the Fed will cut rates in December.
Uncertainty is still a key word which will drive the market sentiment in the week ahead. As per current charts, there is some probability that the yields might test the 4,18% level one more time. On the opposite side, modest easing in yields, might revert them toward levels slightly below the 4,1% level.

US10YThe market still can't figure out what to make of COVID. Continuing to coin in this 3 year long consolidation phase.
US 10Y TREASURY: The 4% expected to holdWith the U.S. government shutdown limiting official data, investors are turning to alternative economic indicators to gauge the economy. A University of Michigan survey on Friday showed consumer sentiment fell to 50.3 in November, well below the expected 53.0 and near historic lows. Concerns deepened after Challenger, Gray & Christmas reported October job cuts surged to 153,074, triple September’s figure and the highest for any October since 2003. In the environment of economic data blackout, it is very hard for investors to estimate the state of the US economy.
The 10Y US benchmark yields increased during the week to the level of 4,16% on Wednesday and Thursday, however, pulled back on Friday to the closing level of 4,09%. Softer private-sector job data boosted expectations of a Federal Reserve rate cut in December, which now assigns roughly a 67% probability. Considering a “blindfolded” situation with the U.S. macro data, it could be expected for 10Y Treasury yields to hold around the 4% level also in the week ahead.

US10Y UNITED STATES 10YEAR TREASURY BOND YIELD. WEEKLY TF US10Y=4.09% weekly close and i see a pull back into confluence where i expect the US10Y to keep rising possibly into 5.0% 2026
FUNDAMENTALS OF US10Y AND US10.
The US 10-Year Treasury note (US10Y) is a debt security issued by the U.S. Department of the Treasury with a maturity of 10 years. It is a key benchmark in global finance and plays a vital role in the U.S. economy and monetary policy changes .
The US10Y yield represents the return investors demand for lending money to the U.S. government for 10 years.
It reflects expectations about economic growth, inflation, and Federal Reserve monetary policy.
When investors expect stronger growth and inflation, yields rise to compensate for higher risk and eroding purchasing power.
Conversely, in economic uncertainty or deflationary scenarios, yields fall as investors seek safe assets.
How US10Y Affects the U.S. Economy
It serves as a baseline for interest rates on mortgages, corporate bonds, and other loans, influencing borrowing costs for consumers and businesses.
Higher US10Y yields can increase borrowing costs, slowing economic growth but controlling inflation.
Lower yields encourage borrowing and investment, boosting economic activity.
It signals market sentiment about future inflation and growth prospects.
Federal Reserve Interest Rate Decisions and US10Y
The Fed’s policy rate influences short-term interest rates directly but also impacts long-term yields via expectations.
If the Fed signals tightening (rate hikes), long-term yields (like US10Y) tend to rise anticipating higher inflation and borrowing costs.
If the Fed signals easing or cuts rates, yields often decline as inflation and growth expectations moderate.
However, long-term yields can diverge if markets believe Fed policy will not control inflation or economic risks emerge.
Difference Between US10Y Yield and Bond Price
Yield is the effective interest rate earned by investors, inversely related to bond price.
When bond prices rise (due to demand), yields fall, and vice versa.
For example, if a 10-year bond’s fixed coupon is $20 annually, and its price drops from $1000 to $900, yield rises because new buyers pay less but still receive $20.
A bond coupon is the fixed annual interest payment that the bond issuer agrees to pay to the bondholder, usually expressed as a percentage of the bond's face (par) value. It represents the regular income investors receive from holding the bond, typically paid semi-annually or annually until the bond matures.
Key Points:
The coupon rate is the percentage of the bond’s face value paid annually as interest.
For example, a bond with a face value of $1,000 and a 6% coupon rate pays $60 per year, often split into two payments of $30 every six months.
The coupon rate is fixed at issuance and does not change, regardless of market price fluctuations of the bond.
This interest payment compensates investors for lending money to the issuer.
Origin of the Term:
Historically, bonds had physical coupons that investors would clip and redeem for interest payments, hence the name “coupon.”
Importance:
The coupon provides a predictable income stream for bondholders.
The coupon rate helps investors compare bonds, but the current yield (coupon payment divided by current bond price) changes as bond prices change in the market.
The inverse relationship between bond yield and bond price exists because a bond’s coupon payment is fixed, so price changes adjust the yield to reflect current market conditions.
Summary
Bond Coupon: Fixed interest payment from issuer to bondholder, based on face value.
Coupon Rate: Annual interest rate percentage fixed at issuance.
Investors rely on coupons for regular income until maturity.
The US10Y yield is a key economic indicator signaling growth and inflation expectations and influences borrowing costs across the U.S. economy.
The Fed’s interest rate decisions primarily affect short-term rates but also shape US10Y yields through policy signaling.
The bond price and yield move inversely; falling prices raise yields and vice versa, reflecting changing investor demand and market conditions.
This relationship underpins financial markets and monetary policy transmission globally.
#us10y #us10 #bond

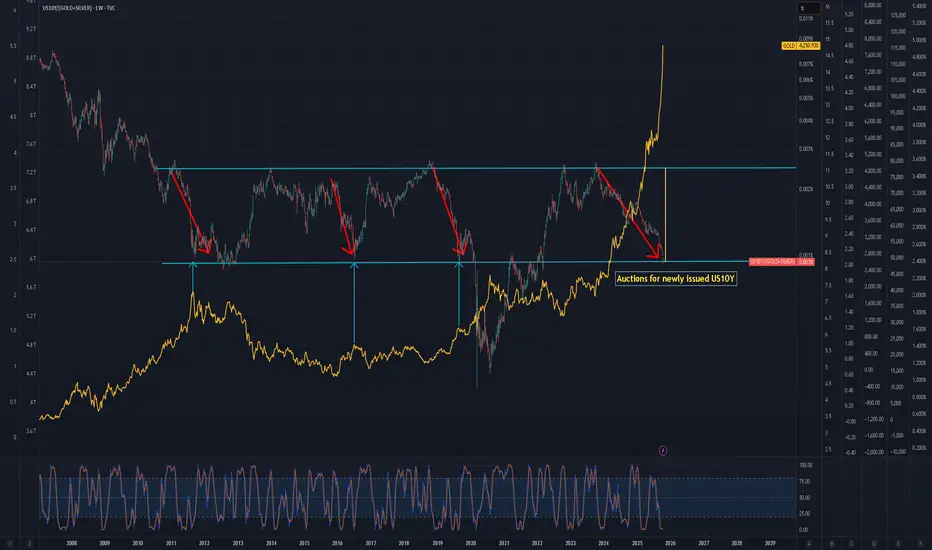
Gold and Silver have a unique relationship with the US10Y.Gold and Silver have a unique relationship with the US10Y since 2011.
Gold+Silver have always had a cool-off period when the US10Y relative touches this range bottom.
Nov US10Y auctions = gold/silver cool-off period.
The bond market MIGHT disagree with rate cuts again.
Interest rate hikes over10Y bond yeilds broke below the 55W averages for a third time. Rates have now closed below the 55W avg a significant number of days.
I believe we will now see a 20year trend of decreasing int rates again approaching zero

US 10Y TREASURY: 4% remains in focusThe most important event during the previous week was the FOMC meeting, held on Wednesday, where the Fed decided to cut interest rates by another 25 basis points. Although the market was expecting that another rate cut is coming in December, still, comments from Fed Chair Powell, that such a course of action might not be in the store, set investors to re-positioning. The 10Y US benchmark yields strongly reacted to Powell's comment, bringing yields back toward the 4,1%. The lowest weekly yield levels were at $3,97% prior to the FOMC meeting.
Considering a strong shift in 10Y yields, it could be expected some relaxation in the week ahead. Still, a stronger move should not be expected. As per current charts, there is a higher probability that the 4% level could be tested for one more time. There is a lower probability for a further move toward the upside in the week ahead, but some volatility around the 4,1% might be expected.

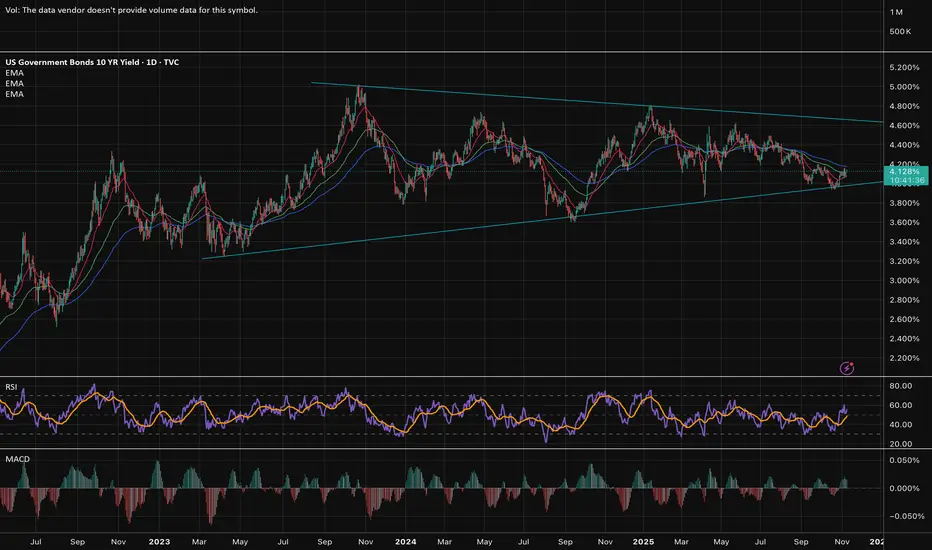
US10Y This break-out can be the next Buy Signal.The U.S. Government Bonds 10YR Yield (US10Y) has been trading within a long-term Triangle pattern and more recently since May 22 2025 it has found itself declining inside a Channel Down.
This Bearish Leg (Channel Down) almost hit the bottom of the Triangle and has been rebounding in the past 10 days. As long as the 1W MA200 (orange trend-line) holds (right now almost at the bottom of the Triangle), the probabilities of a rebound and new Bullish Leg remain strong.
The confirmation for such Bullish Leg will come after the price closes a 1D candle above the 1D MA50 (blue trend-line). If it does, we an expect the price to rise to at least the 0.786 Fibonacci retracement level (Target 4.475%), which has happened all times (3) inside this Triangle after a Bearish Leg bottomed.
-------------------------------------------------------------------------------
** Please LIKE 👍, FOLLOW ✅, SHARE 🙌 and COMMENT ✍ if you enjoy this idea! Also share your ideas and charts in the comments section below! This is best way to keep it relevant, support us, keep the content here free and allow the idea to reach as many people as possible. **
-------------------------------------------------------------------------------
💸💸💸💸💸💸
👇 👇 👇 👇 👇 👇

US 10Y TREASURY: Will the Fed cut?Regardless of a relative volatility between levels of 4,02% and 3,94%, the 10Y US Treasury yields managed to sustain the 4% level during the previous week. The markets were mostly focused on US inflation data which were posted on Friday. The figures show that the inflation currently manages to sustain relatively lower levels, although still elevated from Fed's target of 2% y/y. The inflation in September was standing at 0,3% for the month and 3% y/y. Stable inflation and weakening jobs market have increased odds among investors that the Fed will cut interest rates by 25 bps at their meeting on October 29th.
The major event during the week ahead will be the FOMC meeting. Usually, market nervousness increases prior to the meeting, in which sense, such a behaviour could be expected also this time. There is some probability that yields could seek a bit higher levels in the week ahead, somewhere between 4,04% or 4,08%, but generally, the 4% should continue to hold.
